Continuous Improvement in Food Sanitation: Why Paper Data Is Holding Your Programs Back
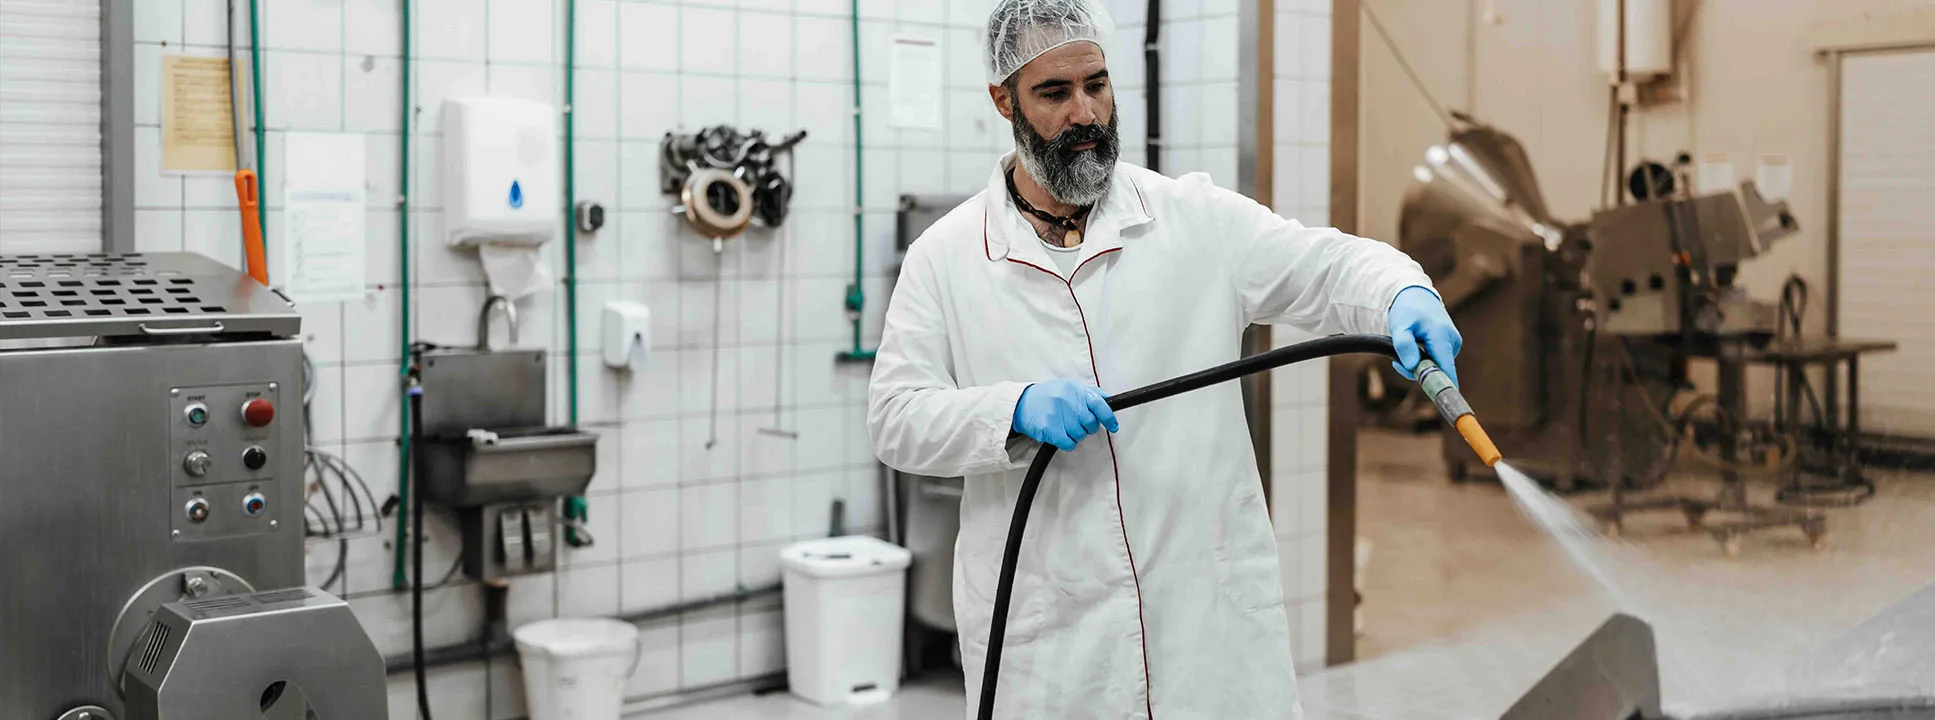
Table of contents

Share:


TL;DR — Sanitation managers report an average pressure-to-improve score of 7 out of 10, with over a third rating it a 10. But continuous improvement requires consistent, comparable data, and paper-based sanitation programs do not produce it. The most common CI activities, SOP updates and kaizens, are also the hardest to measure. Digital sanitation platforms give managers real-time visibility, eliminating data delays and enabling faster, measurable improvements across daily sanitation, MSS, and PIC/PEC.
In This Guide
- How much pressure sanitation managers are under to improve
- Why the shift to 24/7 production makes the scheduling problem worse
- Why paper and spreadsheet data cannot support continuous improvement
- Why the most common CI activities are the hardest to measure
- Why efficiency and compliance are tied as the top challenge
- How digital sanitation platforms close the CI data gap
- FAQ
/
How Much Pressure Are Sanitation Managers Under to Improve?
More than most plant leaders realize. Surveyed sanitation managers gave an average pressure-to-improve score of 7 out of 10. Over a third gave it a perfect 10. This is not a program area where leadership is satisfied with maintaining the status quo. They expect progress.
That pressure is compounded by production demands. Three in five food manufacturing professionals expected throughput to increase by an average of 20% in 2025. Meanwhile, 78% say total cost per product has increased. Sanitation programs are being squeezed in the process. Sanitation cycles have been shortened, budgets cut, and workforces reduced, yet standards continue to rise.
7/10
Average pressure-to-improve score reported by sanitation managers — 37% rated it 10/10
Where Does the Time for MSS and PIC/PEC Come From on a 24/7 Schedule?
This is the question many manufacturers are now facing. As more plants move to 24/7 production schedules, the window for sanitation work shrinks. Daily sanitation tasks still need to happen between production cycles. MSS tasks for warehouses, coolers, and freezers need to be scheduled around operations. And PIC/PEC deep cleans, where equipment is fully disassembled to access niches that daily sanitation cannot reach, need downtime that 24/7 production does not naturally provide.
On paper, scheduling around these constraints is already difficult. When the schedule lives in a spreadsheet that must be manually updated whenever production changes, the risk of missed tasks and scheduling conflicts multiplies. Digital sanitation platforms manage this scheduling complexity automatically, flagging conflicts and rescheduling tasks in real time as production plans shift.
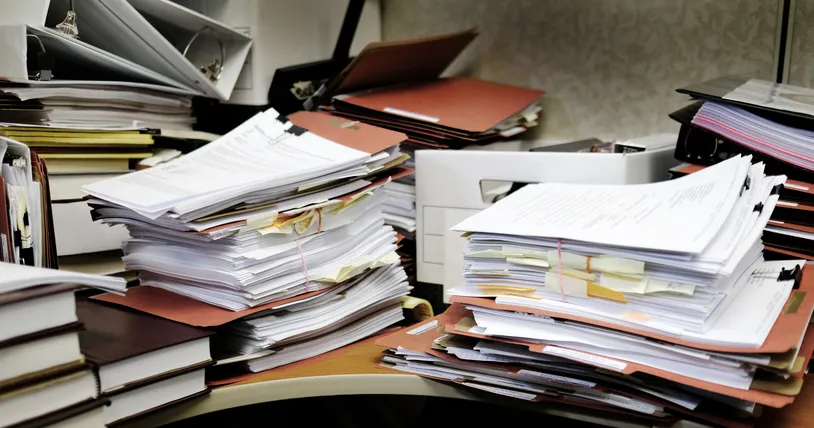
Why Can’t Paper-Based Sanitation Programs Support Continuous Improvement?
Continuous improvement requires data that is consistent, comparable, and available for analysis. Paper-and-spreadsheet-based sanitation programs fail on all three counts.
Scores vary by who recorded them. Action items get missed or lost in transition between shifts. The same problems show up in audit after audit because there is no systematic way to track whether corrective actions were completed. A sanitation manager looking at paper logs cannot answer basic CI questions: Which line consistently takes the longest? Which shift has the most missed tasks? Are we actually getting better, or does it just feel like we are?
The industry is investing heavily in digital tools. Most food manufacturers allocate 26 to 50% of their equipment and systems budgets to digital and automation projects. Yet the execution of all sanitation programs, one of the most compliance-critical functions in the plant, is still the last to get digitized. Companies are investing in analytics and automation while the foundational data layer — who cleaned what, when, and whether it was done correctly — is still captured on paper.
Why Are the Most Common CI Activities the Hardest to Measure?
The survey identified the most common continuous improvement activities in sanitation programs:
- Updating SSOPs (36%): the most common activity, but often reactive rather than proactive. SSOPs get updated after an audit finding, not based on trend data.
- Kaizens (16%): structured improvement events, usually tied to a broader Lean or TPM initiative. Effective but resource-intensive.
- Statistical analysis (12%) and suggestions (12%): used less frequently, often because the data needed to support analysis is not readily available.
- Abnormality reports (8%): a strong CI tool, but only useful when tracked systematically.
Here is the problem: the first two activities, SSOP updates and kaizens, are the most common but are also very difficult to measure in terms of continuous improvement. Performing these tasks does not guarantee improvements. You can update an SSOP and have no way to know whether the update improved execution.
Statistical analysis and abnormality reports depend on gathering information, which takes time and usually occurs after the fact. By the time the data is compiled, the issues have already happened and the improvements lag behind. With a digital sanitation system, that delay virtually disappears. You gain real-time visibility, enabling you to make decisions and implement improvements more quickly than a paper-based system ever could.
Why Are Efficiency and Compliance Tied as the Top Challenge?
Survey data shows compliance and efficiency are tied as the number one challenges for sanitation managers. That is not a coincidence. They are two sides of the same problem.
The efficiency challenge is not about crews working harder. It is about lines being down too long during changeovers and sanitation cycles. When a sanitation event takes 45 minutes instead of 30, that is not a labor problem. It is a process visibility problem. The manager cannot see which tasks are running long, which crews are consistently faster, or which lines need different sequencing, because paper does not produce that data.
Meanwhile, the compliance challenge feeds the efficiency problem. When sanitation managers spend 18+ hours a week on administrative tasks — building reports, chasing down missed tasks, updating schedules — that is time they cannot spend on the process improvements that would make the program more efficient.
Digital daily, MSS, and PIC/PEC programs help close this gap by flagging delays in real time and giving managers the data to identify the who, what, when, why, and how behind tasks that are consistently causing issues, before the next audit or the next downtime event.
How Does Digital Sanitation Close the CI Data Gap?
A digital sanitation platform captures every cleaning event with consistent, structured data: who performed the task, when, how long it took, whether it was completed correctly, and what issues were flagged. That data is available in real time, comparable across shifts and sites, and ready for the analysis that CI demands.
The delay between issue and improvement virtually disappears. Instead of waiting for an audit to discover recurring problems, managers can see them as they happen. Instead of relying on a supervisor’s memory to know which line is the bottleneck, the data shows it. Instead of updating SSOPs reactively after a finding, managers can update them proactively based on trend data.
- Real-time visibility into task completion, duration, and quality across daily sanitation, MSS, and PIC/PEC
- Automatic flagging of missed tasks, delays, and recurring issues
- Data that supports statistical analysis, trend identification, and ROI measurement
- Consistent scoring that does not vary by who recorded it or which shift captured it
Frequently Asked Questions
What is the biggest barrier to continuous improvement in sanitation?
Data availability. Most sanitation programs running on paper and spreadsheets do not produce consistent, comparable data. The most common CI activities, SSOP updates and kaizens, are also the hardest to measure. Without real-time data, managers cannot identify trends, measure improvement, or prove ROI.
Can I do continuous improvement without a digital sanitation platform?
You can do some CI activities, like SSOP updates and occasional kaizen events. But data-driven CI, identifying which lines run long, which crews are most efficient, and whether changes are producing measurable results, requires consistent data that paper programs cannot provide. And the improvements will always lag behind the issues.
How does digital sanitation help prove ROI for improvements?
Digital sanitation captures baseline data from day one: task completion rates, time per task, issue frequency, and corrective action closure rates. As improvements are made, the data shows the impact in measurable terms. That gives sanitation managers the proof they need when leadership asks whether the investment is working.
How do plants on 24/7 production schedules fit in MSS and PIC/PEC work?
It is one of the biggest scheduling challenges in food manufacturing right now. Digital sanitation platforms automatically manage scheduling complexity, flagging conflicts with production schedules and rescheduling tasks in real time. On paper, this coordination requires manual effort that grows exponentially as production hours expand.
Are food manufacturers actually investing in digital sanitation tools?
The investment intent is there. In a 2025 industry survey, 93% of food and beverage end users said they expect to spend the same or more on food safety and sanitation in the coming year. Most food manufacturers are already allocating 26 to 50% of their equipment budgets to digital projects. The question is whether that budget reaches the sanitation program or stops at production and maintenance.
Conclusion
Sanitation managers are under real pressure to improve, and they are doing CI work with the tools they have. But paper-and-spreadsheet-based programs are fundamentally limited: they do not produce the data that makes continuous improvement sustainable, and the most common CI activities are the hardest to measure.
Digital sanitation platforms close the gap by capturing structured data on every cleaning event across daily sanitation, MSS, and PIC/PEC, making it available in real time, and eliminating the delay between issue and improvement. The result is a sanitation program that can prove its improvements, not just describe them.
The industry is investing in digital tools. The budget is there. The question is whether it reaches the programs that need it most: the ones still running on paper, under the most pressure, with the least visibility.
Ready to see what digital sanitation looks like for your plant? Talk to Weever → CLICK HERE

Don’t miss what’s next
Stay updated with the latest insights, deep dives, and expert perspectives.

Spend Less Time on Admin. More Time Improving Operations.
See how Weever automates data entry, reporting, and action items so you can focus on improvement not admin.