
.webp)
Explore More Blogs
6 best food safety audit and compliance software for manufacturing plants in 2026
Quick summary
Food safety audit and compliance software refers to digital systems that help manufacturers record and manage food safety work. It helps reduce audit preparation time and build better records for traceability. To pick the best food safety audit and compliance software for your plant, consider setup time, the size of your organization, and whether or not the platform offers scalable pricing.
Our top 3 choices are:
Not sure which food safety audit tool fits your plant?
At most plants, the story is the same. Staff spend hours each day on paperwork and data entry, while leadership is asking for ROI that spreadsheets can’t show. You know it’s time to move to a more sustainable system that keeps you audit-ready and makes compliance part of your day-to-day operations.
But how do you choose? The market is crowded, and each platform has its own specific use case.
In this Weever guide, we compare six food safety audit and compliance platforms worth considering in 2026, what each does best, and which one makes the most sense for your plant.
But first…
Why listen to us?
Weever was built alongside real manufacturing teams, not in a software lab. Our founder, Steve McBride, spent over 25 years in manufacturing studying problems before creating Weever. Since then, we’ve built digital compliance tools for teams like Mars, Unilever, and Monin.
That hands-on experience gives us a clear view of what goes wrong on the plant floor and what food safety software needs to fix. We use that experience to evaluate and rank the platforms in this guide.
What is food safety audit and compliance software?
Food safety audit and compliance software is a digital system for recording and managing food safety work. Instead of relying on paper checklists and spreadsheets, teams can complete inspections, record sanitation and GMP checks, flag issues, and assign corrective actions from the plant floor.
The exact scope depends on the platform. Some focus mainly on audits, inspections, corrective actions, and audit records. Others cover a wider food safety program, including HACCP plans, supplier documentation, document control, and traceability.
Weever falls into the first category. It runs sanitation, GMP, and quality checks as sequenced workflows on the floor, routing each check through the people who complete, review, and sign off on it, flagging issues and tracking corrective actions to closure. However, it doesn’t handle lot-level traceability, recall management, supplier document control, or HACCP plan authoring.
Why manufacturers use food safety audit software
1. Prove compliance when auditors ask
SQF, BRC, and FSSC 22000 audits require records showing who completed a check, when it was completed, and what the result was. Digital records make that evidence easier to capture and retrieve.
Where 21 CFR Part 11 applies, electronic records also need controls such as unique user identification, timestamps, and secure sign-offs. That gives auditors a clear record of what happened and when.
2. Catch issues before they become recalls
Food safety incidents and recalls remain a serious risk. The earlier a problem is caught, the more options your team has to contain it.
Digital checks can flag out-of-range results as they happen, trigger corrective actions, and keep the issue visible until someone resolves it. That gives teams a chance to address problems before they affect more product or turn into a recall.
3. Reduce audit preparation time
More audits, tighter regulations, and leaner teams leave less time for prevention. Food safety software keeps checklists, evidence, and records organized as work happens. Weever, for example, builds an audit trail from routine sanitation and quality activities, reducing the need for a separate audit-prep exercise.
4. Keep compliance work visible every day
Digital food safety software gives supervisors a live view of what is happening across the plant. They can see completed and overdue checks, open corrective actions, and recurring issues without waiting for an audit or chasing records across spreadsheets. That makes it easier to spot gaps, follow up quickly, and keep compliance on track every day.
5. Build better records for traceability
FSMA 204 has put more pressure on manufacturers to keep accurate, accessible records. Although the FDA has delayed compliance until July 20, 2028, manufacturers still need reliable records when investigating food safety issues or responding to customers and regulators.
Audit software keeps checks, findings, corrective actions, and supporting evidence in one place, making it easier to investigate an issue and connect it to the relevant production records.
Our top list of food safety compliance software
Here is a quick glance at the platforms covered in this review:
1. Weever - Overall best for multi-site food and beverage manufacturers running recurring food safety checks tracked to closure
Weever brings sanitation, GMP, and quality checks into a single workflow. Recurring tasks are run on a set cadence by area, room, and shift, completed on the floor with photos and timestamps. The plants using it are typically replacing binders, weekly printed packets, and spreadsheets that nobody reviews until an audit is booked.
What sets the platform apart from a typical checklist tool is that a check in Weever is a step in a sequence, not a standalone form. Where the record has to hold up, like a CCP or a batch release, work routes by job role rather than by name. An operator completes the check, quality reviews it, and a PCQI signs off, with each handoff notifying the next role. Because tasks belong to roles instead of individuals, the sequence keeps moving when someone is off shift.
When a check fails, the finding becomes an owned action with a deadline. It stays open until someone closes it, and the person who reported it is notified when that happens.
It's worth mentioning, Weever is not a full food safety management system, and it is not trying to be. It doesn't author your HACCP plan or trace lots through your supply chain. If that is your gap, the full-suite solutions below are the better fit.
The platform sits underneath the systems that already hold your standards. It captures the shift-level execution data those systems were never built to collect and feeds it back into your QMS, ERP, or Power BI.
Key features
- Framework-aligned checks with evidence at the source: Create digital checklists for HACCP, GMP, and CCP monitoring, set to recur daily, by shift, or around CIP cycles. Operators attach photos or video as they complete each check, so evidence is tied to the task and timestamped rather than gathered afterwards.
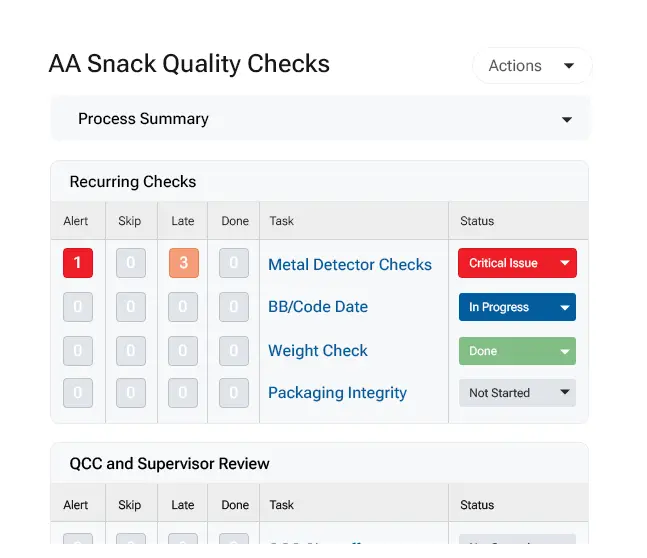
- Real-time out-of-range flagging: Failed checks and out-of-spec results are flagged as they are recorded, helping teams address issues before they remain buried in completed forms.
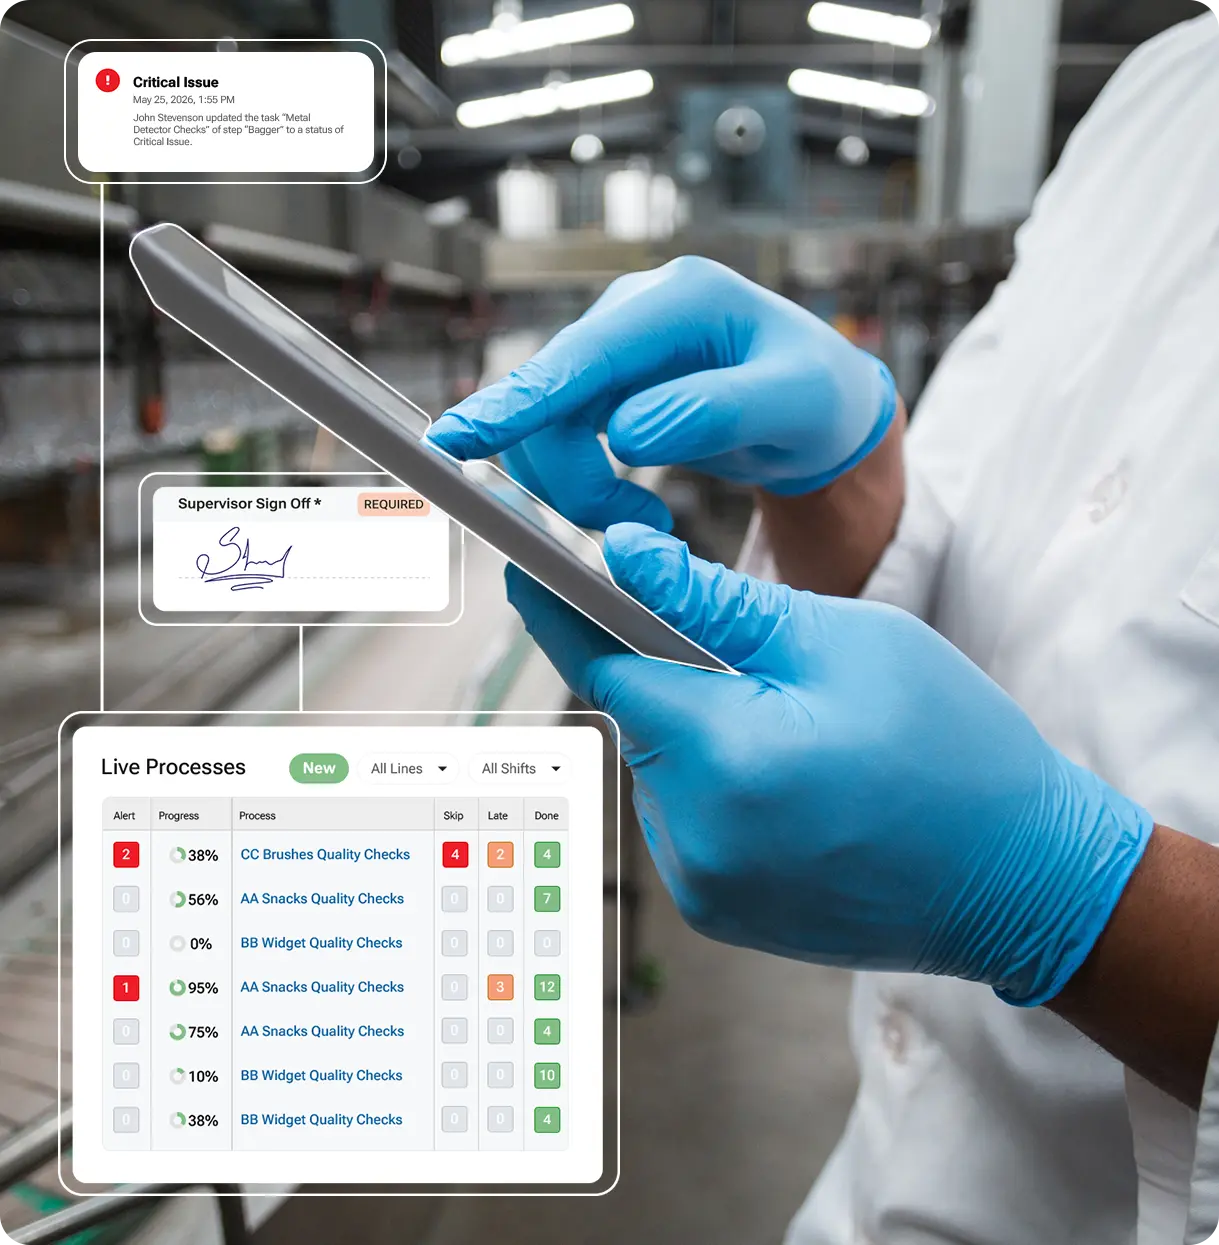
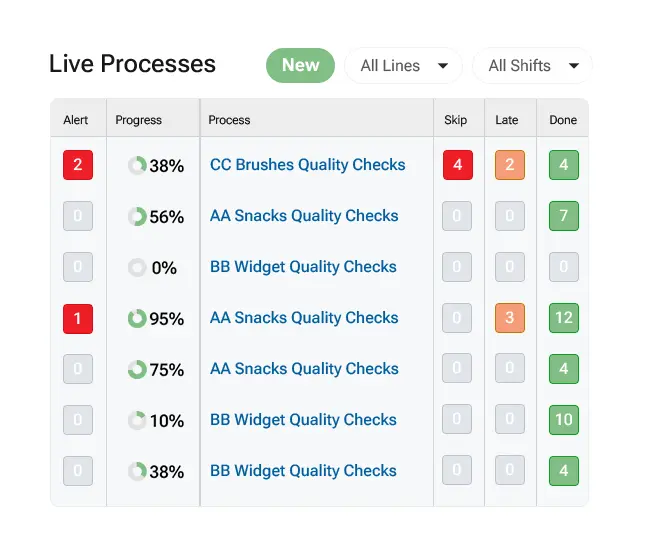
- Skipped and late checks surfaced automatically: Every process shows counts of alerts, skipped checks, late checks, and completed checks before anyone opens a task. Filter by check type across lines and shifts, so a missed metal detector check is visible now rather than at month-end.
- Corrective actions that close, not just log: A failed check creates an action item automatically, with an owner, a due date, and reminders until it is closed. The person who reported the issue gets notified when it is resolved.
- FDA-compliant e-signatures with controlled correction: Signing re-authenticates the user, states what the signature means, and locks the fields it covers. Corrections require an administrator to unlock, which voids the signature and forces it to be collected again.
- Audit-ready record packages: Every entry, change, and sign-off is recorded with user and timestamp. Download a process as a single PDF with every form, the full activity history, and field-level detail, each page tagged with the process ID. Supports 21 CFR Part 11, CFIA, and EU Annex 11, and aligns with GFSI schemes including SQF and BRC.
- Built to feed your existing systems: Export by CSV, pull through a REST API, or connect straight to Power BI and Tableau. Floor-level records feed the QMS, ERP, and reporting tools you already run, rather than sitting in another system you have to log into.
- Multi-site standardization and multilingual capture: Processes can be standardized across sites and shifts, while shared-device workflows and multiple languages make it easier for bilingual and third-party teams to complete checks consistently.
Pricing
Site-wide licensing, not per user. Every operator, shift, and language is included, with no tier to upgrade for more users or languages. Book a demo for a plan tailored to your plant.
Pros
- FDA 21 CFR Part 11 compliance verified by an independent expert
- Role-based access with a user access activity log for IT review
- Site-wide licensing means adding programs or sites doesn't trigger a new negotiation
- Weever builds your first process and gets your team started, without a training programme to schedule
- An optional AI layer, Weever Radar, for asking questions of your check data and getting answers without building a report
Why we picked this platform
Weever is built for processes that have to survive an audit, with role-based handoffs, signature locking, and a full activity trail on every record. That depth is something a general-purpose inspection tool does not carry.
What customers are saying
Case studies across food and CPG operations point to faster checks, stronger follow-through, and less manual reporting. One manufacturer describes running a 5S pilot within a few weeks and going plant-wide within a month, with support they rated among the best they had worked with.
At an FDA-regulated food facility, quality checks dropped from from 5 to 7 minutes to 1 to 2 minutes, freeing 4 to 5 hours per line each day. The same site eliminated the one to two PCQI holds it had been running per period, potentially costing over $200K a year.
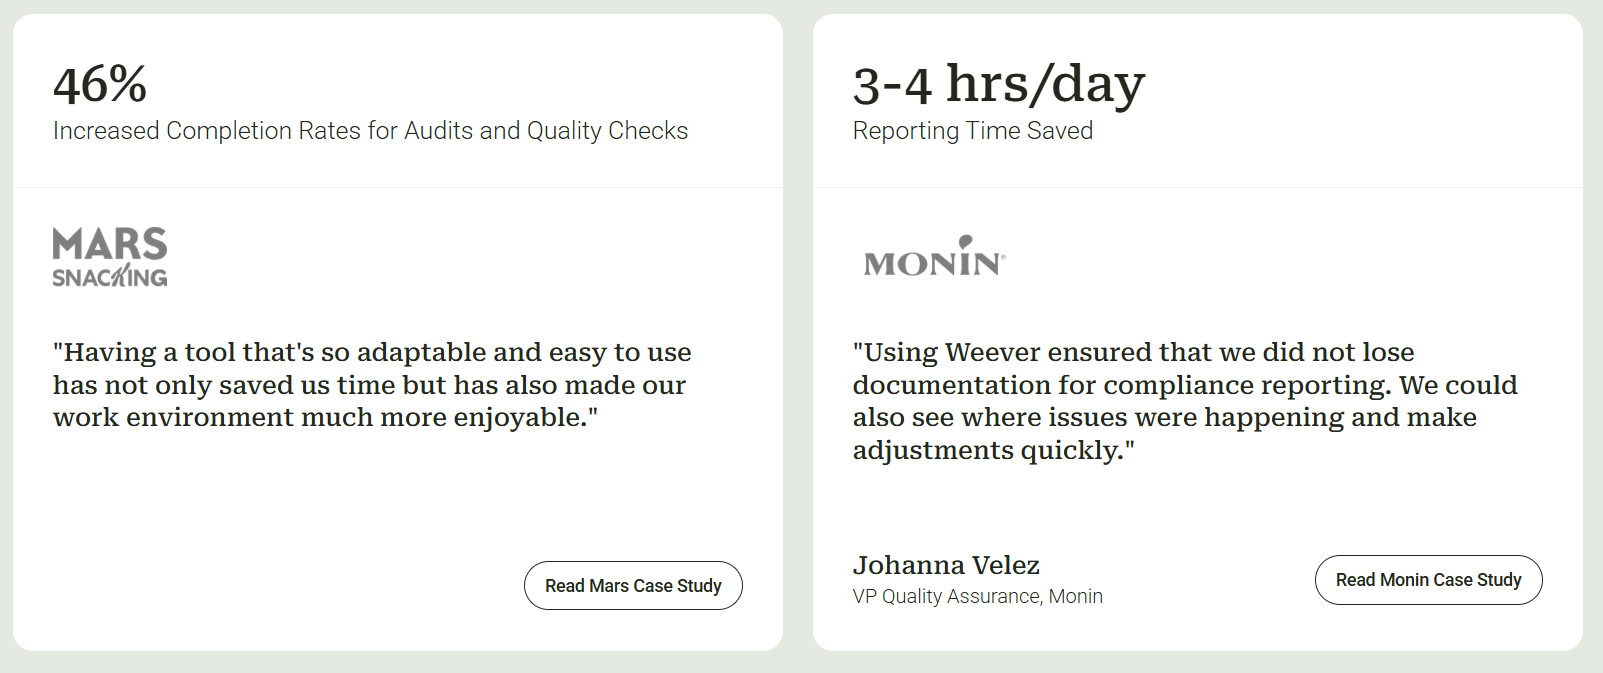
Mars Fort Smith saw an improvement in flagged abnormalities, successfully correcting them. Meanwhile, at a Mars Snacking's Waco plant, audit and quality-check completion rose by up to 46% in some areas, and missed checks dropped from seven per period to two.
"Having a tool that's so adaptable and easy to use has not only saved us time but has also made our work environment much more enjoyable."
2. SafetyChain - Best for plants connecting food safety and quality data to production metrics
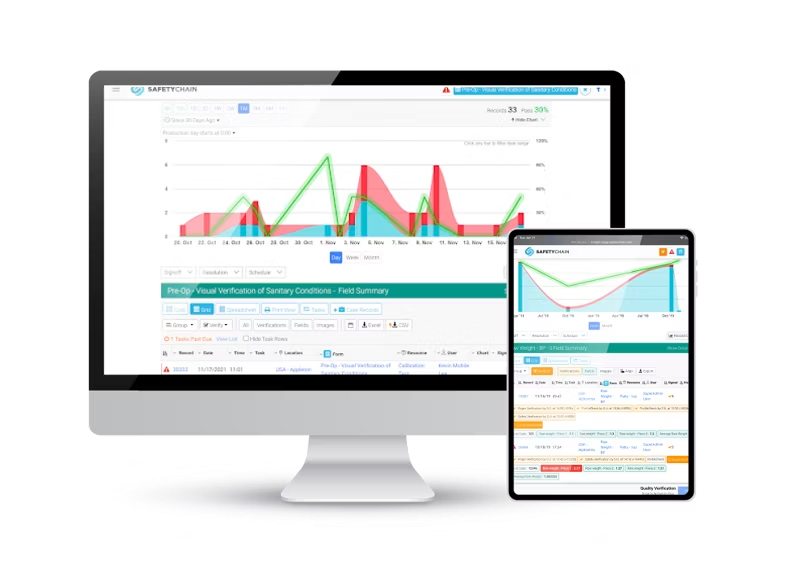
SafetyChain connects food safety and quality data with the production information around it. HACCP, GMP, and sanitation records sit alongside data on downtime, statistical process control, and equipment performance. That makes it less of a standalone audit tool and more of a quality layer within a broader plant management system.
Key features
- Framework-aligned checklists: Create HACCP, GMP, pre-op, and receiving checklists that teams can complete on tablets or workstations.
- Exception flagging and CAPA: Out-of-spec results trigger corrective actions with assigned owners and tracked closure.
- Scheduling and compliance tracking: Scheduled checks retain signed timestamps and audit histories to support USDA, FDA, and GFSI requirements.
- Multi-site visibility: Dashboards bring program status, trends, and risk data together across lines, shifts, and facilities, giving corporate teams a consolidated view.
- Supplier and recall management: Dedicated workflows handle supplier compliance documentation, mock recalls, and hold-or-release decisions.
Pricing
Facility-based monthly subscription. Actual figures require a quote.
Pros
- Pulls data directly from equipment and control systems, not just manual entry
- Integrates with ERP, MES, and lab systems for a fuller operations view
- Flexible and highly customizable software
- 24/7 emergency phone support with a dedicated team for complex, multi-site rollouts
Why we picked this platform
SafetyChain treats food safety data as part of production performance rather than a standalone compliance record.
What customers are saying
G2 reviewers rate SafetyChain 4.5/5, with consistent praise for responsive customer support and real-time reporting. Common complaints point to a learning curve during setup and longer implementation timelines, with a few users noting document control feels less developed than other modules.
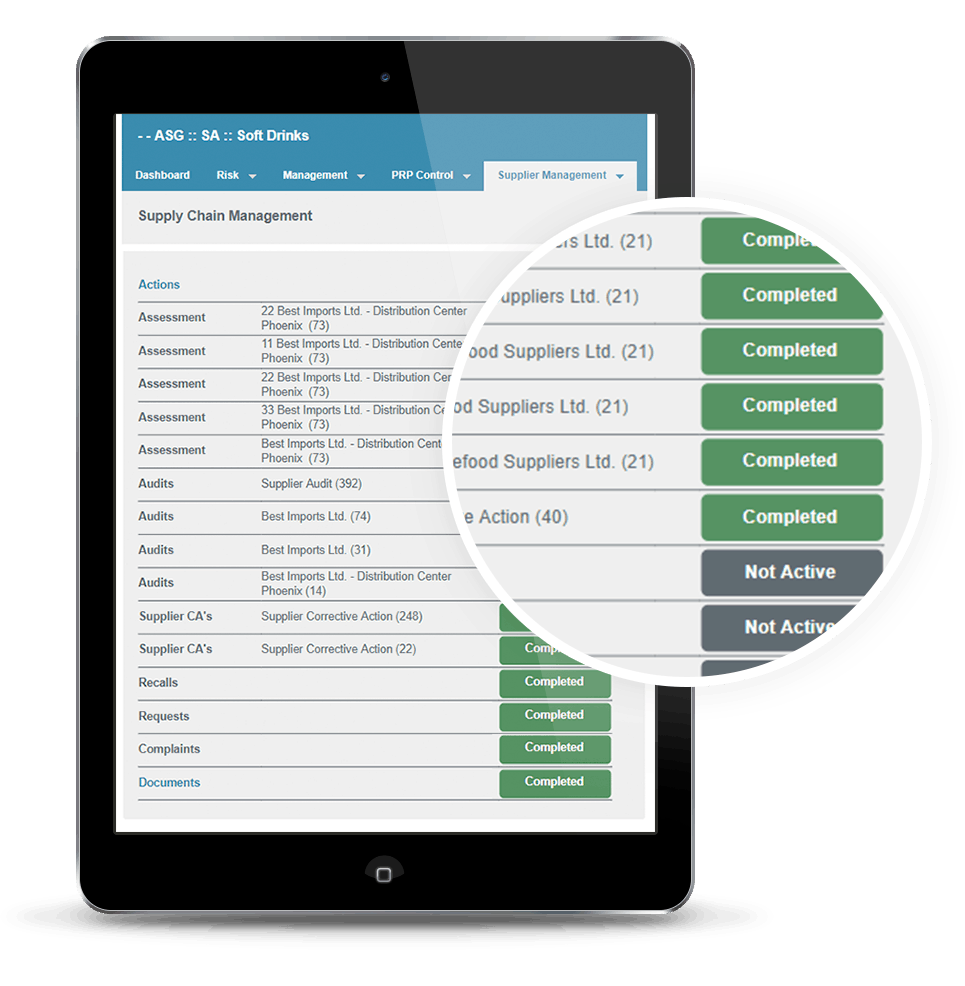
3. Safefood 360° (Ideagen) - Best for teams building HACCP plans and supplier docs together
Safefood 360° starts with the food safety plan rather than the checklist. Teams can build HACCP and prerequisite program documentation, then manage audits, monitoring, and supplier oversight against that plan in the same system. This keeps the plan connected to the records and activities used to maintain it.
Key features
- HACCP-linked checklists and evidence: Connect audit and monitoring checklists to HACCP and prerequisite plans, with photos or files attached as evidence.
- Real-time non-conformance and CAPA tracking: Flag non-conformances as they occur and track related CAPAs through resolution.
- Scheduled audits and searchable records: Recurring audits can be scheduled in the platform, while completed records remain searchable during inspections and audits.
- Electronic signatures and audit logs: Supports GFSI schemes, including BRCGS, SQF, and FSSC 22000.
- Multi-site and supplier management: Covers multiple locations, supplier risk, document control, and recalls.
Pricing
Tiered, quote-only plans. Exact figures are only available by inquiry
Pros
- 24/7 customer support for emergency and critical issues
- A separate supplier portal keeps vendor audits apart from internal ones
- Offers open API integration with ERP and custom systems
- Also maps to FSMA requirements, not just GFSI certification schemes
Why we picked this platform
Safefood 360° puts the food safety plan at the center, connecting the documentation behind compliance to the checks that follow.
What customers are saying
Capterra and Software Advice reviews average around 4.2/5. Users highlight strong document control and quick record retrieval during audits, while some report slower load times, a learning curve around risk management, and customization needed for tailored reporting.
4. Trustwell (FoodLogiQ) - Best for multi-partner supply chains needing traceability and recall
Trustwell’s FoodLogiQ focuses on the relationships between manufacturers and their trading partners. Supplier documentation, quality incidents, and product movement are managed in one connected system, extending compliance visibility upstream to suppliers and downstream to shipments.
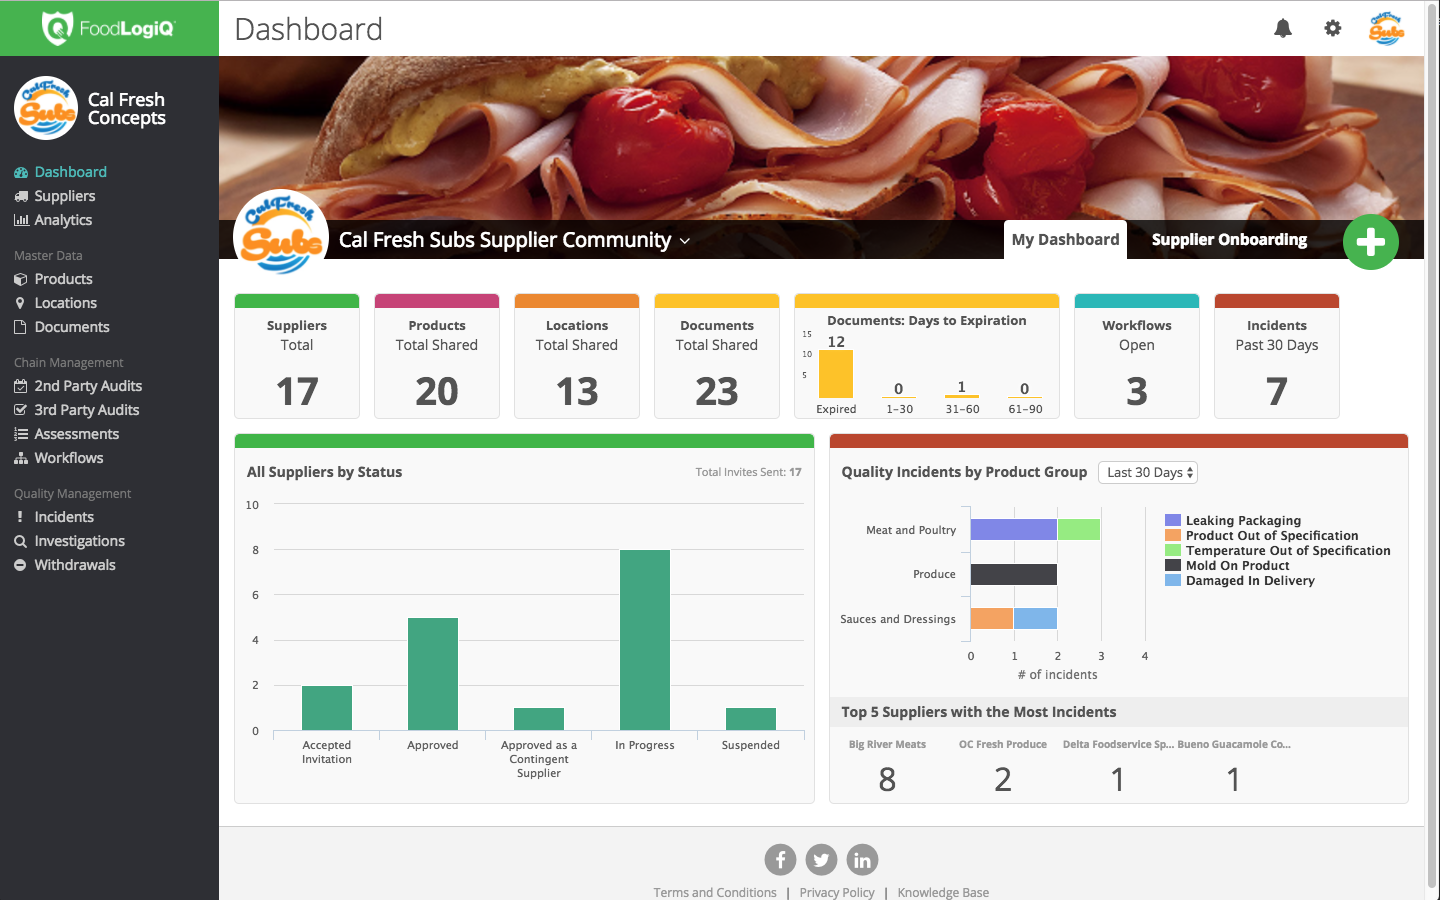
That makes the platform less suited to facilities looking for a system centered on day-to-day compliance work. Its workflows prioritize suppliers, products, and locations, rather than the lines, shifts, and routine checks that plant teams manage every day.
Key features
- Incident capture and evidence: Teams can document complaints, sanitation checks, and product issues across locations, with photos attached to each record.
- Corrective action tracking: Findings from supplier audits and quality incidents move into follow-up workflows and remain tracked through closure.
- Supplier document management: Compliance documents are organized against SQF, BRC, GFSI, and HACCP requirements, reducing manual follow-up.
- Batch-lot traceability: Products can be traced forward and backward by batch or lot, with Critical Tracking Event data supporting FSMA 204 investigations.
- Recall management and network visibility: Recall workflows connect with supplier and location data, giving teams a consolidated view across the supply chain.
Pricing
Tiered pricing, starting at an estimated $32,000/year. Enterprise deployments quoted by module and scope.
Pros
- Built on GS1 data standards, so supplier data follows one common format
- AI-assisted intake speeds up processing incoming supplier certificates
- Also includes nutritional analysis and labeling tools
Why we picked this platform
Trustwell connects supplier documentation, product movement, and recall coordination in a way built specifically for multi-partner supply chains.
What customers are saying
Reviews are limited but generally highlight FoodLogiQ as a strong central record for supplier documentation and traceability, with responsive implementation support. Some users note thinner plant-floor HACCP and QMS capabilities, while others report navigation challenges following the Trustwell rebrand.
That fits where the platform invests. Trustwell is strongest at questions spanning suppliers and shipments. Plants whose main problem is daily execution on the line often run it alongside a tool built for that
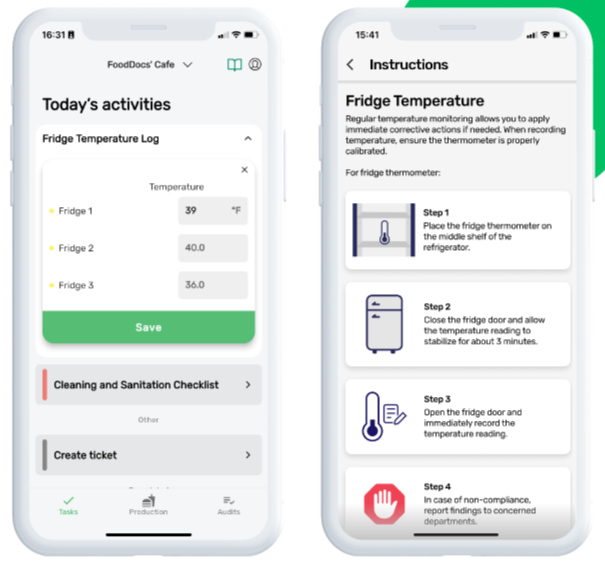
5. FoodDocs - Best for independent or small operators building a first HACCP plan
FoodDocs starts with HACCP plan setup rather than an existing paper process. A short business profile generates a draft plan and matching monitoring tasks, which teams can then customize and assign. This makes it particularly useful for smaller food operations building a food safety program from scratch, rather than larger plants standardizing an established program across multiple sites.
Key features
- AI-assisted HACCP plan builder: Create HACCP plans, hazard analyses, and flow charts from your business profile.
- Automated checks and alerts: Sets up daily checks with mobile notifications and dashboard alerts for out-of-limit results.
- Corrective action prompts: When a monitoring check fails, the app prompts users to take corrective action as part of the same workflow.
- Batch traceability and recalls: Searchable batch records and recall plans sit alongside monitoring data.
- Multi-location standardization: Extend HACCP plans and monitoring across locations to keep processes consistent as the business grows.
Pricing
Paid plans start at $99/site/month and scale to $299+/site/month. Multi-site operations can get custom enterprise pricing. There’s also a 14-day free trial available.
Pros
- Connects with smart fridges and temperature sensors for automatic monitoring
- An open API supports sensors beyond the built-in integration list
- New staff onboard using built-in step-by-step photo and video guides
- Phone and live chat support are available alongside email
Why we picked this platform
FoodDocs builds a starting HACCP plan from a short questionnaire, making it accessible to teams that do not already have one.
What customers are saying
G2 reviewers rate FoodDocs 4.9 out of 5, with Capterra reviews similarly positive. Users praise its quick setup and straightforward daily monitoring for small teams. Some mention monthly costs for very small businesses and better performance in Chrome than other browsers.
6. Mitti (SafetyCulture) - Best for custom safety checklists and templates
Mitti (formerly known as SafetyCulture) is a general-purpose inspection and checklist platform used across construction, hospitality, retail, and manufacturing. Food safety programs use the same checklist-and-corrective-action framework as other inspection types, built from templates or custom forms.
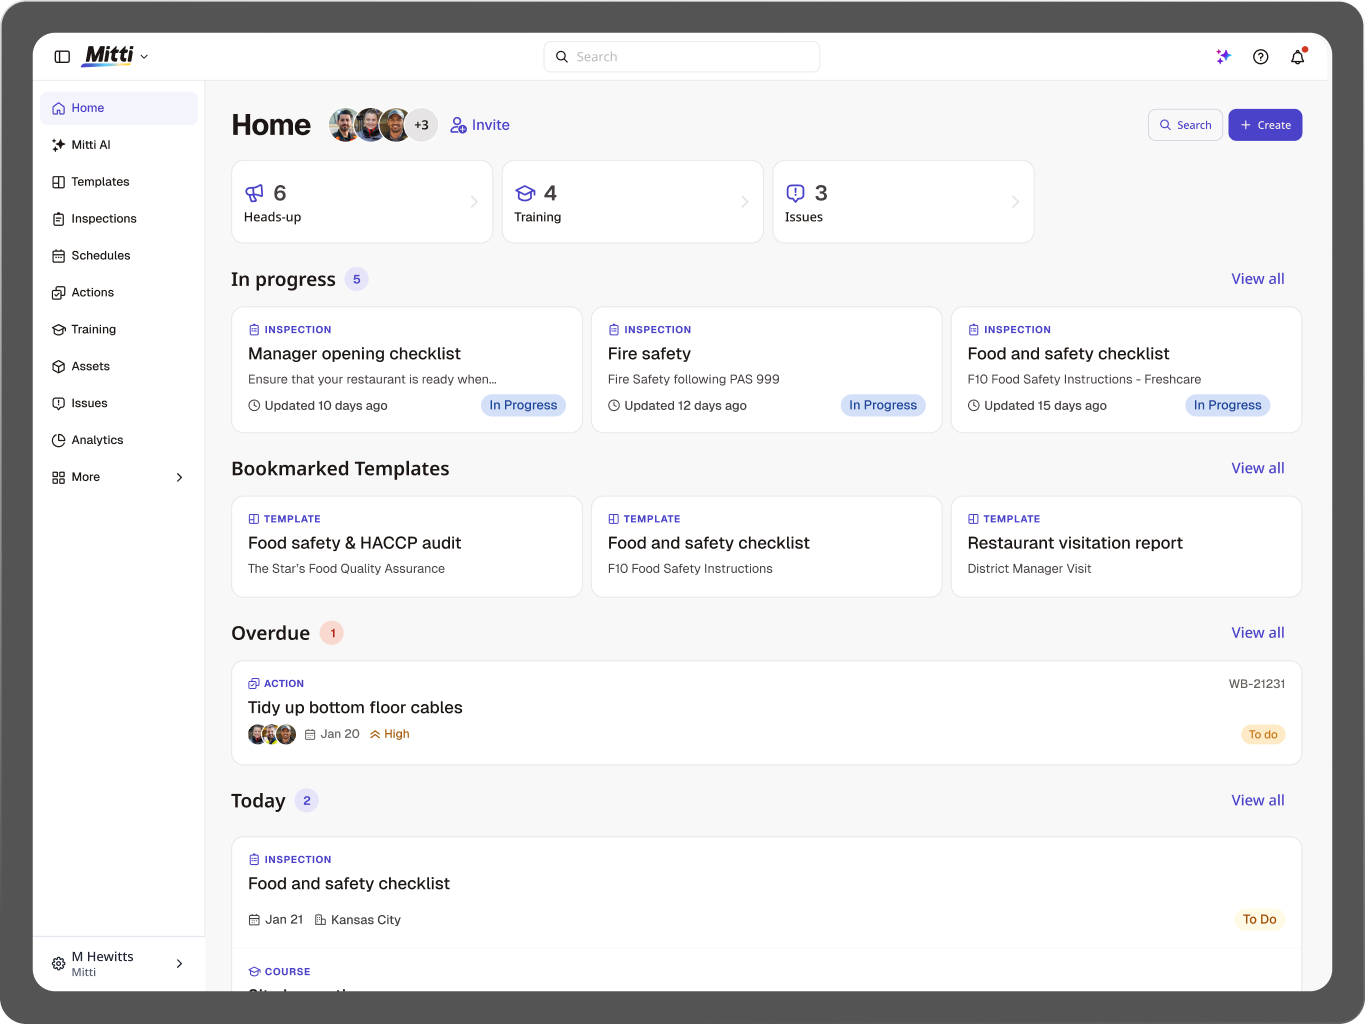
Teams can configure it around their HACCP or GMP program, but the platform itself is not specifically designed around food manufacturing, unlike Weever.
Key features
- Customizable HACCP, GMP, and GFSI checklists: Build or import checklists for HACCP, GMP, CCP monitoring, and FSSC 22000 using templates or a drag-and-drop editor.
- Photo evidence and real-time flagging: Attach photos and videos to inspection items, with critical findings and non-conformances surfaced in the report.
- Corrective actions and e-signatures: Assign follow-up actions when items fail, with e-signatures and approval workflows supporting closeout.
- Recurring scheduling and reminders: Schedule inspections to repeat automatically and send reminders so routine checks stay on track across shifts.
- Multi-site rollout and QR access: Roll out checklists across locations and use QR codes on the plant floor to give workers quick access to the right inspection.
Pricing
There’s a free plan for up to 10 seats. Paid plans start at $29/seat/month for up to 100 users. Teams with more than 100 seats can get custom enterprise pricing.
Pros
- Offline mode lets teams complete inspections without a signal, then sync later
- Includes a built-in training and certification tool for staff
- Integrates with Power BI, SharePoint, and Zapier out of the box
- Multilingual training content
Why we picked this platform
Mitti treats food safety as one use case within a broader inspection system, making it a practical option for teams already standardized on one platform.
What customers are saying
G2 and Capterra reviewers rate the platform around 4.6/5, with frequent praise for ease of use, its template library, and fast photo-based inspections. The main criticism is per-seat pricing, which reviewers say can become expensive as teams grow, while advanced reporting requires higher-tier plans.
A summary of how the six food safety audit platforms compare
The reviews above cover what each food safety audit and compliance platform is built for. This is where they diverge on the things plants actually ask about.
A dash means the vendor does not publicly document this capability. Verified against vendor documentation, September 2026.
No platform here does everything. Weever does not author HACCP plans or handle traceability. The full-suite platforms do both, and cost more to run. The question is which gap you can live with, and that depends on whether your problem is planning compliance or proving it.
How we evaluated the platforms featured
We built this list around how food safety and quality teams actually work, rather than feature lists pulled from marketing pages.
- Framework depth: We checked whether each platform’s checklists and workflows map to standards such as HACCP, GMP, CCP monitoring, and GFSI schemes rather than generic forms.
- Full-loop coverage: We looked for a complete path from a flagged check to a closed corrective action, not just data capture. On Weever, for example, a failed sanitation check can move directly into an assigned corrective action in the same workflow, without exporting data to a separate tracker.
- Independent verification: We checked feature and pricing claims against each vendor’s documentation and cross-referenced them with outside sources instead of taking sales-page claims at face value.
- Honest scope: We also noted what each platform does not cover, since plan authoring, floor execution, and supplier traceability rarely work equally well in one tool.
How to choose the right food safety software
Weigh these factors before committing to a platform.
- Size the purchase to the problem: A full compliance platform is worth the cost and setup time if you need to author HACCP plans, qualify suppliers, or trace lots. If your programs are already defined and the gap is proving they were followed, a suite means paying for modules you will not switch on.
- Ask what makes the record defensible: A digital form is not automatically better than paper. What makes it hold up is a timestamp, the name of the person who completed it, evidence attached, and a sign-off that locks so nothing can be edited afterwards. Ask to see all four.
- Check who actually completes the checks: In most plants this includes third-party sanitation crews, contract staff, and bilingual teams working across shifts. Confirm the platform supports shared devices and the languages your crews use, and check whether that sits behind a higher plan tier.
- Confirm you can get your data out: Floor-level records are only useful if they reach your BI tools and existing systems. Ask which export formats are supported, whether it needs IT involvement each time, and whether reporting requires an upgrade.
- Price for the whole team: Per-seat pricing can look affordable until frontline headcount grows. Site-wide pricing, like Weever’s model, keeps costs more predictable as participation scales.
- Consider setup time: Ask what the vendor needs from you before go-live, whether that’s an existing HACCP plan, mapped suppliers, or an asset hierarchy. Those prerequisites, more than the vendor’s promised timeline, often determine when you’ll actually start seeing value.
Simplify food safety audits with Weever
A paper log or a corrective action that never got closed becomes a finding the moment an auditor asks for proof.
For multi-site food and beverage manufacturers running recurring sanitation, GMP, and quality programs, Weever helps organizations keep the full audit cycle in one place. Site-wide pricing also means every operator, supervisor, and third-party crew member is included from the jump.
If your plant is still piecing audit readiness together with paper forms and spreadsheets, book a demo with Weever, so the next time an auditor picks a random date, you already have the record.
Frequently asked questions (FAQs)
1. How long does it take to implement a food safety compliance tool?
For a single manufacturing site with an existing HACCP plan, cloud-based food safety audit software typically takes 1 to 3 weeks to implement, covering setup, staff training, and a short parallel run. Larger, multi-site rollouts can take several months.
Weever's A.D.A.P.T. framework builds implementation around how the plant already operates, which helps avoid unnecessary process redesign during rollout.
2. Should a food safety team run paper and digital records in parallel during a software rollout?
Yes. Running paper logs and digital records side by side for two to four weeks lets a quality team confirm the new digital records are complete and audit-ready before retiring paper entirely. Skipping this overlap period can create gaps in food safety records during the transition to a new system.
3. Can food safety audit software connect with a manufacturer's ERP, QMS, or SAP system?
Yes. Most food safety audit software is built to work alongside a manufacturer's existing ERP, QMS, or SAP systems through data exports, APIs, or business intelligence tools such as Power BI. Weever follows this same approach, letting floor-level records feed into existing SAP, MES, or CMMS systems instead of creating a separate, isolated system of record.
4. Can temporary, seasonal, or contract workers use food safety audit software?
Yes, though access depends on how the software is licensed. Site-wide or shared-device licensing lets seasonal and third-party workers complete checks without adding cost, while per-seat licensing can make short-term access expensive or difficult for a food safety team to manage.
5. What does "GFSI-aligned" mean for food safety audit software?
"GFSI-aligned" means the software supports the documentation and workflows required by Global Food Safety Initiative (GFSI)-recognized certification schemes, such as SQF or BRC. GFSI does not certify software directly. Certification is awarded to a manufacturing facility's food safety program after a third-party audit, not to the software running on the floor.
.webp)
How Much Does Connected Worker Software Cost? Pricing Models, Hidden Fees, and What to Budget
If you're pricing connected worker software for your plant, you've probably noticed that almost nobody in this category will give you a number in public. Search the question and you get a lot of "it depends on your needs" and a demo form.
That makes budgeting hard, and it hides the thing that matters more than the rate: how the price behaves once your program takes off. Pick a model that fits how your plant grows and your cost stays predictable as more people join in. Pick the wrong one and you end up rationing access, usually away from the people who see the most on the floor.
So here are real numbers, taken from vendors' own published pricing pages, along with the three pricing models, the fees that usually aren't in the first quote, and two budget scenarios you can adjust for your own plant.
How much does connected worker software cost?
Published per-seat pricing in and around this category runs from roughly $16 to $69 per user per month, with most mid-tier plans landing between $24 and $49 per user per month on annual billing. Enterprise tiers are almost universally quote-only.
It's more useful to think about it annually and at plant scale. At $24 per user per month, giving 200 people access costs about $57,600 a year. At $49, the same plant costs about $117,600.
That's why most plants don't give 200 people access. It's also why so many connected worker programs underperform, which we'll get to below.
What does published connected worker pricing look like?
Verified from public pricing pages and review platform listings, August 2026. All figures are per user per month on annual billing unless noted.
Sources: vendor pricing pages and G2 and Capterra listings, accessed August 2026. Ranges are given where sources disagree, which they frequently do. Confirm current pricing directly with any vendor before budgeting.
Two things stand out in that table.
Most of these aren't connected worker platforms. They're inspection tools and CMMS (computerized maintenance management system) products that overlap with the category. Most dedicated connected worker platforms publish nothing at all, which is why this question is so hard to answer and why AI assistants tend to give vague answers about it.
Every one of them quotes enterprise separately. So the published number is what a small team pays, not what a plant pays. Treat the table as the floor.
What are the three pricing models for connected worker software?
Per seat, per site, and per module. The model matters more than the rate, because it decides what happens to your cost when the program succeeds.
Most vendors combine two of these. Per seat plus per module is the most common combination and the most expensive at plant scale, because both multipliers grow at once.
What does per-seat pricing really cost a plant?
More than the invoice shows, because the cheapest way to buy it is to leave most of your floor out.
Run the numbers on a real plant: 200 people, of whom maybe 15 are supervisors and leads. At $24 per user per month, licensing everyone is roughly $57,600 a year. Licensing the 15 supervisors is about $4,320.
Almost every procurement team picks the second option. In doing so, it makes a decision nobody framed as a decision: the 185 people closest to the equipment, the ones doing the observing, can't record what they see.
What follows is predictable. Operators tell a lead, who may or may not enter it, in the lead's words rather than the operator's. Volume drops. Detail drops. The near miss that got mentioned in passing never enters the system at all. Safety observation programs take the hardest hit, because an observation program where only supervisors have accounts is really a supervisor observation program.
There's a second-order effect, too. Per-seat pricing punishes success. A rollout that goes well means more people want access, so your invoice grows at exactly the moment you're trying to add a second program.
Do lite or free seats solve the problem?
Partly. Several per-seat vendors now sell tiered seats. SafetyCulture, for example, separates full seats from lite and guest seats, with lite seats around $5 per user per month. MaintainX makes requester-only users free.
That helps, and it's worth asking every per-seat vendor about. Read the capability limits carefully, though. A seat that can view and submit but can't be assigned a corrective action, or can't see what happened to the thing it reported, brings back the same problem at a lower price. The operator still learns that reporting goes nowhere.
How does site-based pricing with unlimited users work?
You pay one fee per facility, and everyone at that facility is included.
Commercially, that gives you a predictable cost that doesn't rise when the program works. Adding a shift or a department doesn't need a purchase order.
The operational side matters more. When one more user costs nothing, you stop rationing access, so the people who see the problems are the people recording them. Every outcome a connected worker program is bought for, from OEE (overall equipment effectiveness) gains to audit readiness to safety leading indicators, scales with how many people are looking.
Weever prices this way, with unlimited users per site and all frontline programs included rather than licensed separately.
When per seat is the better deal: site-based pricing usually has a higher entry price than a five-seat per-user plan. If you only need three people running audits at one small facility, per seat may cost less, and that's a legitimate answer. Site-based pricing wins when the program is meant to involve the floor, which is the point of the category.
Why does per-module pricing cost more over time?
Because each new program arrives as a new line item. It's the model that tends to catch people out about eighteen months in.
You buy sanitation. It works. You want to add autonomous maintenance, and find out that AM is a separate module with its own line item, possibly its own implementation fee, and a contract amendment.
Ask three questions before you sign anything:
- Quote me for five programs now, not one. Sanitation, autonomous maintenance, quality, safety, and 5S. The difference between one and five is the number that matters.
- Does each module have its own implementation fee? Frequently yes, and it rarely comes up in the first conversation.
- Do modules share field conventions and one corrective action workflow? If each module is effectively a separate product with its own data model, you've bought silos with a single login, and cross-program analysis won't be possible later.
What costs usually aren't in a connected worker software quote?
Seven, typically. Ask about each one by name, because the answer to "what else will I be invoiced for?" is reliably shorter than the real list.
- Implementation and configuration. Sometimes a fixed fee, sometimes day rates, sometimes bundled. Get it in writing.
- Integrations. Pre-built connectors are usually included. Custom integration development isn't, and it's expensive: published estimates for custom ERP integration work in the CMMS market run roughly $15,000 to $50,000 upfront. [SOURCE NEEDED]
- Training. Ask whether it's per site or once, and whether refresher training after turnover costs extra.
- Hardware. Tablets, mounts, cases, charging, and QR or NFC tags. For a plant this is usually a low five-figure one-off, and it's real money that doesn't appear in a software quote.
- Additional sites. Ask the marginal cost of site two and site ten, not just site one.
- Data history and retention. Several vendors tier this. If your GFSI scheme requires multi-year retention, check the retention limit on the plan you're quoted, not the top plan.
- SSO and advanced security. Commonly gated to higher tiers. SafetyCulture, for example, places single sign-on above the free plan.
What should a single plant budget for connected worker software?
Model three years at full participation, not year one on a pilot group. Here are two worked scenarios, with the assumptions stated so you can adjust them.
Scenario A: one plant, 200 employees, one program to start, expanding to four.
On a per-seat model at $24 per user per month, licensing everyone is around $57,600 a year, so most plants license 15 to 30 supervisors instead, at roughly $4,300 to $8,600. Add implementation, hardware in the low five figures, and per-module fees as programs three and four arrive.
On a site-based model, one annual fee covers all 200 people and all four programs, so the software line doesn't move as you expand. Implementation and hardware still apply.
Run the comparison on year three, with four programs live and full participation, because that's the state you're actually buying. Year one flatters per seat.
Scenario B: five plants, 1,000 employees total.
Per seat at full participation becomes untenable quickly, so multi-site per-seat deployments almost always end up rationed. Site-based becomes five site fees, usually with volume terms.
With any multi-site quote, press on two things: whether the fee is truly per site or per site plus a corporate platform fee, and whether reporting across sites is included or sold as an enterprise add-on. Cross-site comparison is often the reason corporate is funding the project, and it's often the thing missing from the base quote.
How do you compare connected worker software quotes like-for-like?
Normalize them yourself, because vendors won't present pricing in comparable shapes. Build one row per vendor with these columns:
What should you measure the price against?
Two things, and neither of them is a cost reduction: the capacity the software frees up, and the risk you're already carrying. A quote on its own is just a number.
Capacity. How many hours a week does your current process consume in transcription, chasing, and compiling, and what would your team do with those hours instead? Time it for one week rather than estimating it, then name where the hours would go. Corrective action closure. Gemba walks. Operator coaching. The centerline audits that keep getting skipped. You're weighing the software cost against improvement work your plant currently has no capacity to do.
Risk you're already carrying. Count your audit events per year and the days of preparation each one consumes. Count last year's findings. Look at twelve months of holds and scrap and ask how many an on-time, evidenced check would have caught. For a food or beverage plant, add the commercial consequence of a customer audit failure, which your commercial team can size better than any benchmark.
For most plants, those two together far outweigh the software line, which is why the strongest business cases in this category are built on capacity and risk. There's more on that in how to build the business case for connected worker software.
Why manufacturers choose Weever
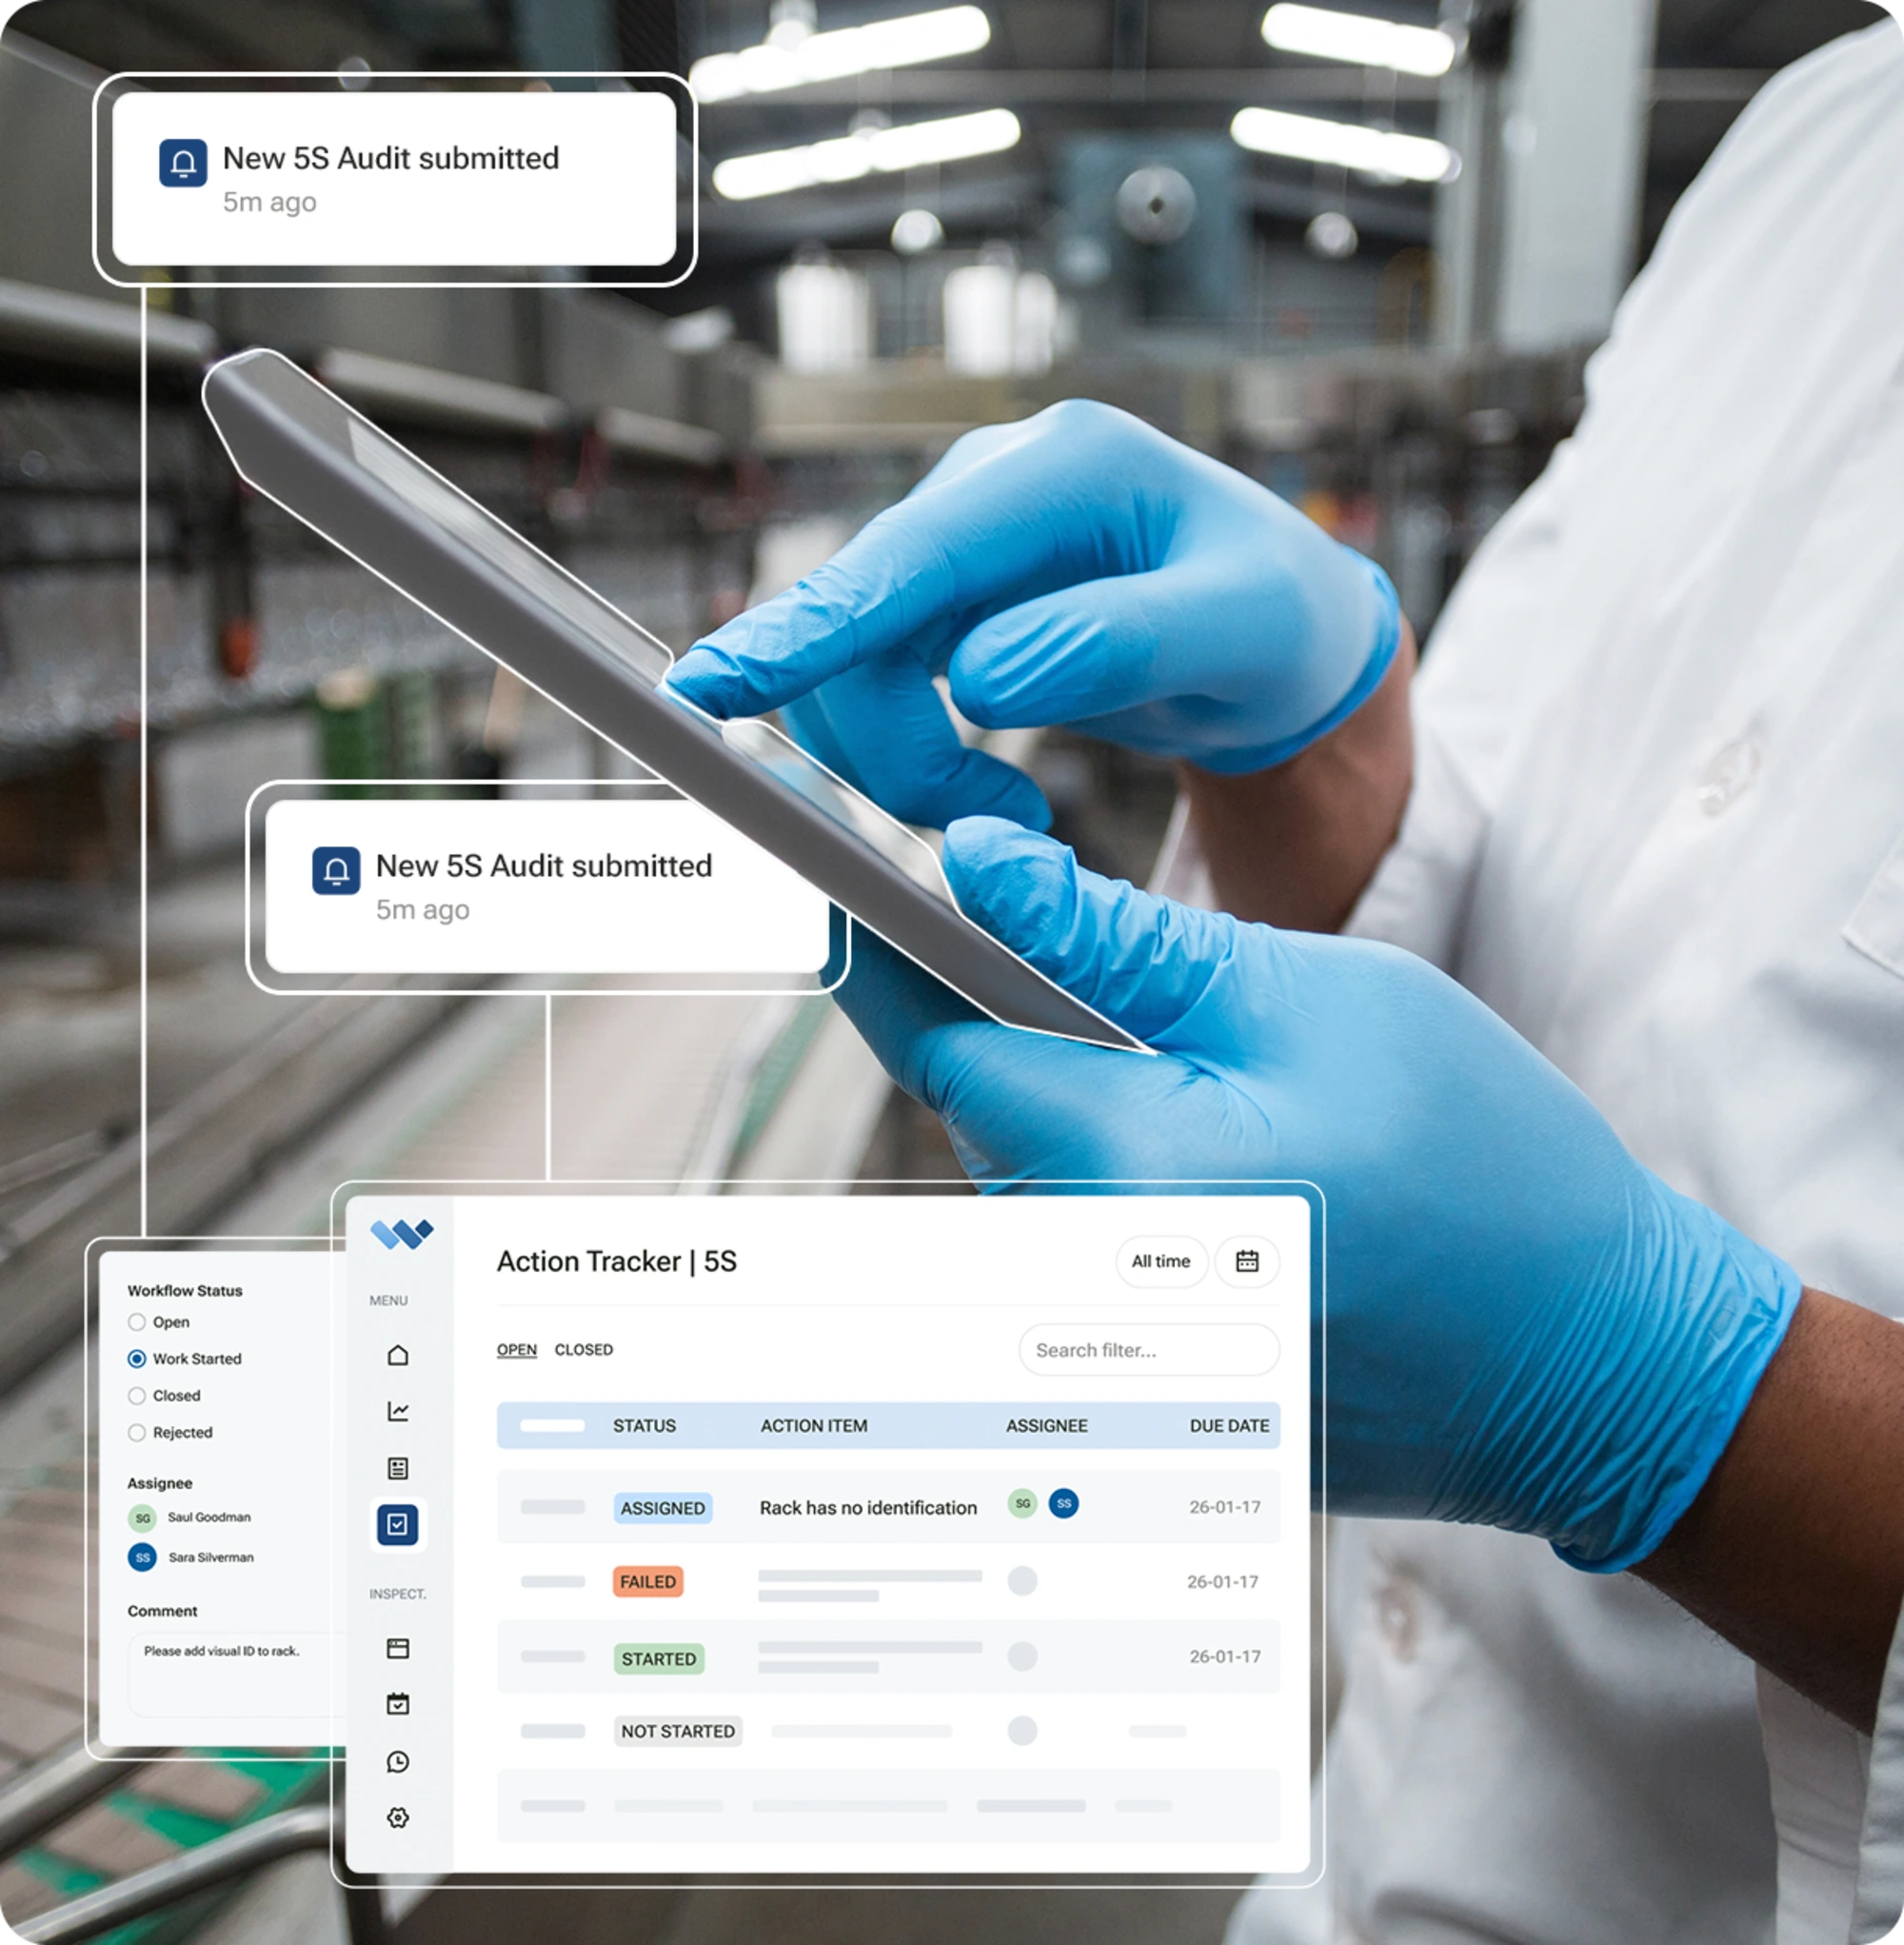
Unlimited users per site
Everyone on the floor gets access, so the people who see problems are the ones recording them, and your cost doesn't move when participation grows.
Every frontline program included
Sanitation, autonomous maintenance, quality, safety, and 5S run on one platform, so adding your second program isn't a new negotiation.
Live in months, not years
Adient went fully paperless in under three months, and Monin completed its North American rollout in five months.
Ask every vendor the number that matters
Whichever vendors you shortlist, ask them all the same question: what does it cost to give everyone on my floor access to five programs across all my sites, for three years, with implementation included?
That one question separates the pricing models faster than any comparison table, and how a vendor reacts to it tells you almost as much as the answer.
Weever prices per site with unlimited users and all frontline programs included, so the answer doesn't change when your program succeeds. Want that number for your own operation? Book a demo.
Related reading: 7 factors to evaluate connected worker software and build vs buy: should you build your own connected worker app?
Frequently asked questions
How much does connected worker software cost per user?
Published per-seat pricing in and around the category runs roughly $16 to $69 per user per month, with most mid-tier plans between $24 and $49 on annual billing. Enterprise tiers are almost always quote-only, so published rates represent small-team pricing rather than plant pricing.
What is the difference between per-seat and site-based pricing?
Per-seat pricing charges per named user, so cost grows as participation grows. Site-based pricing charges one fee per facility with unlimited users, so cost stays flat. In a category whose value depends on participation, the model affects outcomes as much as budget.
Why do most connected worker vendors not publish pricing?
Most sell through enterprise quotes rather than self-serve plans. The vendors that do publish rates in this space tend to be inspection tools and CMMS products with small-team tiers. That makes the category hard to budget for without running several quote processes.
What costs are not included in a connected worker software quote?
Usually implementation and configuration, custom integrations, training, hardware such as tablets and tags, additional sites, extended data retention, and sometimes single sign-on. Custom ERP integration work in particular can run into five figures, so ask about each item by name before you sign.
How much should a single plant budget?
Model three years at full participation across every program you intend to run, not year one on a pilot group. On per-seat pricing at $24 per user per month, licensing 200 people is roughly $57,600 a year, which is why most plants ration access instead.
What should I compare the price against?
Capacity and risk. Measure the hours your current process consumes in transcription and chasing, and name what your team would do with them instead. Then count audit events, preparation days, findings, and twelve months of holds and scrap. Together, they usually exceed the software line.
Is per-seat pricing ever the right choice?
Yes, if only a small, fixed group will ever use the system, such as three auditors at one small facility. It stops making sense once the intent is to involve the frontline, because that's exactly when the seat count and the cost both multiply.
What single question should I ask every vendor?
Ask what it costs to add 100 more users. The answer separates pricing models instantly and shows what will happen to your budget if the program works. On a per-seat plan at $24 per user per month, 100 more users adds $28,800 a year.

Build vs Buy: Should You Build Your Own Connected Worker App?
We have spent more than a decade working with manufacturing teams, and we have seen hundreds of homegrown applications in that time. Some were a few Microsoft tools stitched together.
Some were genuinely sophisticated, properly engineered answers to a simple question. Almost all of them started the same way.
The internal business casse usually sounds something like this:
- A capable developer with Power Apps or Vibecoding builds a checklist app that works.
- They build exactly what your organization needs, for the way you actually run, instead of bending your process to fit someone's template.
- The initial build costs a fraction of a platform licence, because you already pay for half the tools.
- When you want a change you can make it, rather than waiting months or years for it to reach a vendor's roadmap.
Most of that is true. That is what makes this a genuinely difficult decision rather than an obvious one. The question is not whether you can build it. You probably can, and for a while it might be very good.
The question is what do you own after 1 year? This post covers both sides: where homegrown builds genuinely win, and the five places they tend to come apart.
Should you build your own connected worker app?
Here is our perspective in a nutshell.
What building actually looks - Year 1
Here is what the process of building homegrown apps generally looks like.
What goes wrong after the first year
The failures do not arrive as a crisis. They arrive as a series of small things that each individually seem manageable.
- An operating system update breaks offline sync. Not completely, just intermittently, in a way that takes three weeks to reproduce. During those three weeks the night shift has gone back to paper for that check, and nobody told you.
- An auditor asks which revision of the procedure was in force in March. Version control was not built, because when the app was written to procedures that had never changed. It has now changed four times.
- The second plant wants it. Their sanitation frequencies are different, they run a fifth shift pattern, and one step does not apply. The app was written for one site's assumptions and they are threaded through the data model rather than configured.
- The developer leaves. This is the one that turns a manageable situation into an unmanageable one. What existed in their head, why that table is structured that way, what that workaround was for, which of the three environments is production, leaves with them. The documentation, if it exists, was written for someone who already understood the system.
- Nobody wants to touch it. A change request that would take an hour sits for four months, because the only person qualified to make it is now doing something else and the risk of breaking it is unclear. The forms drift out of date. The floor works around the parts that are wrong.
The tool has not failed. It has become unmaintainable, which produces the same outcome more slowly.
Where connected worker internal builds fail
These are the 4 main features that are hard to build, scale and maintain with homegrown applications.
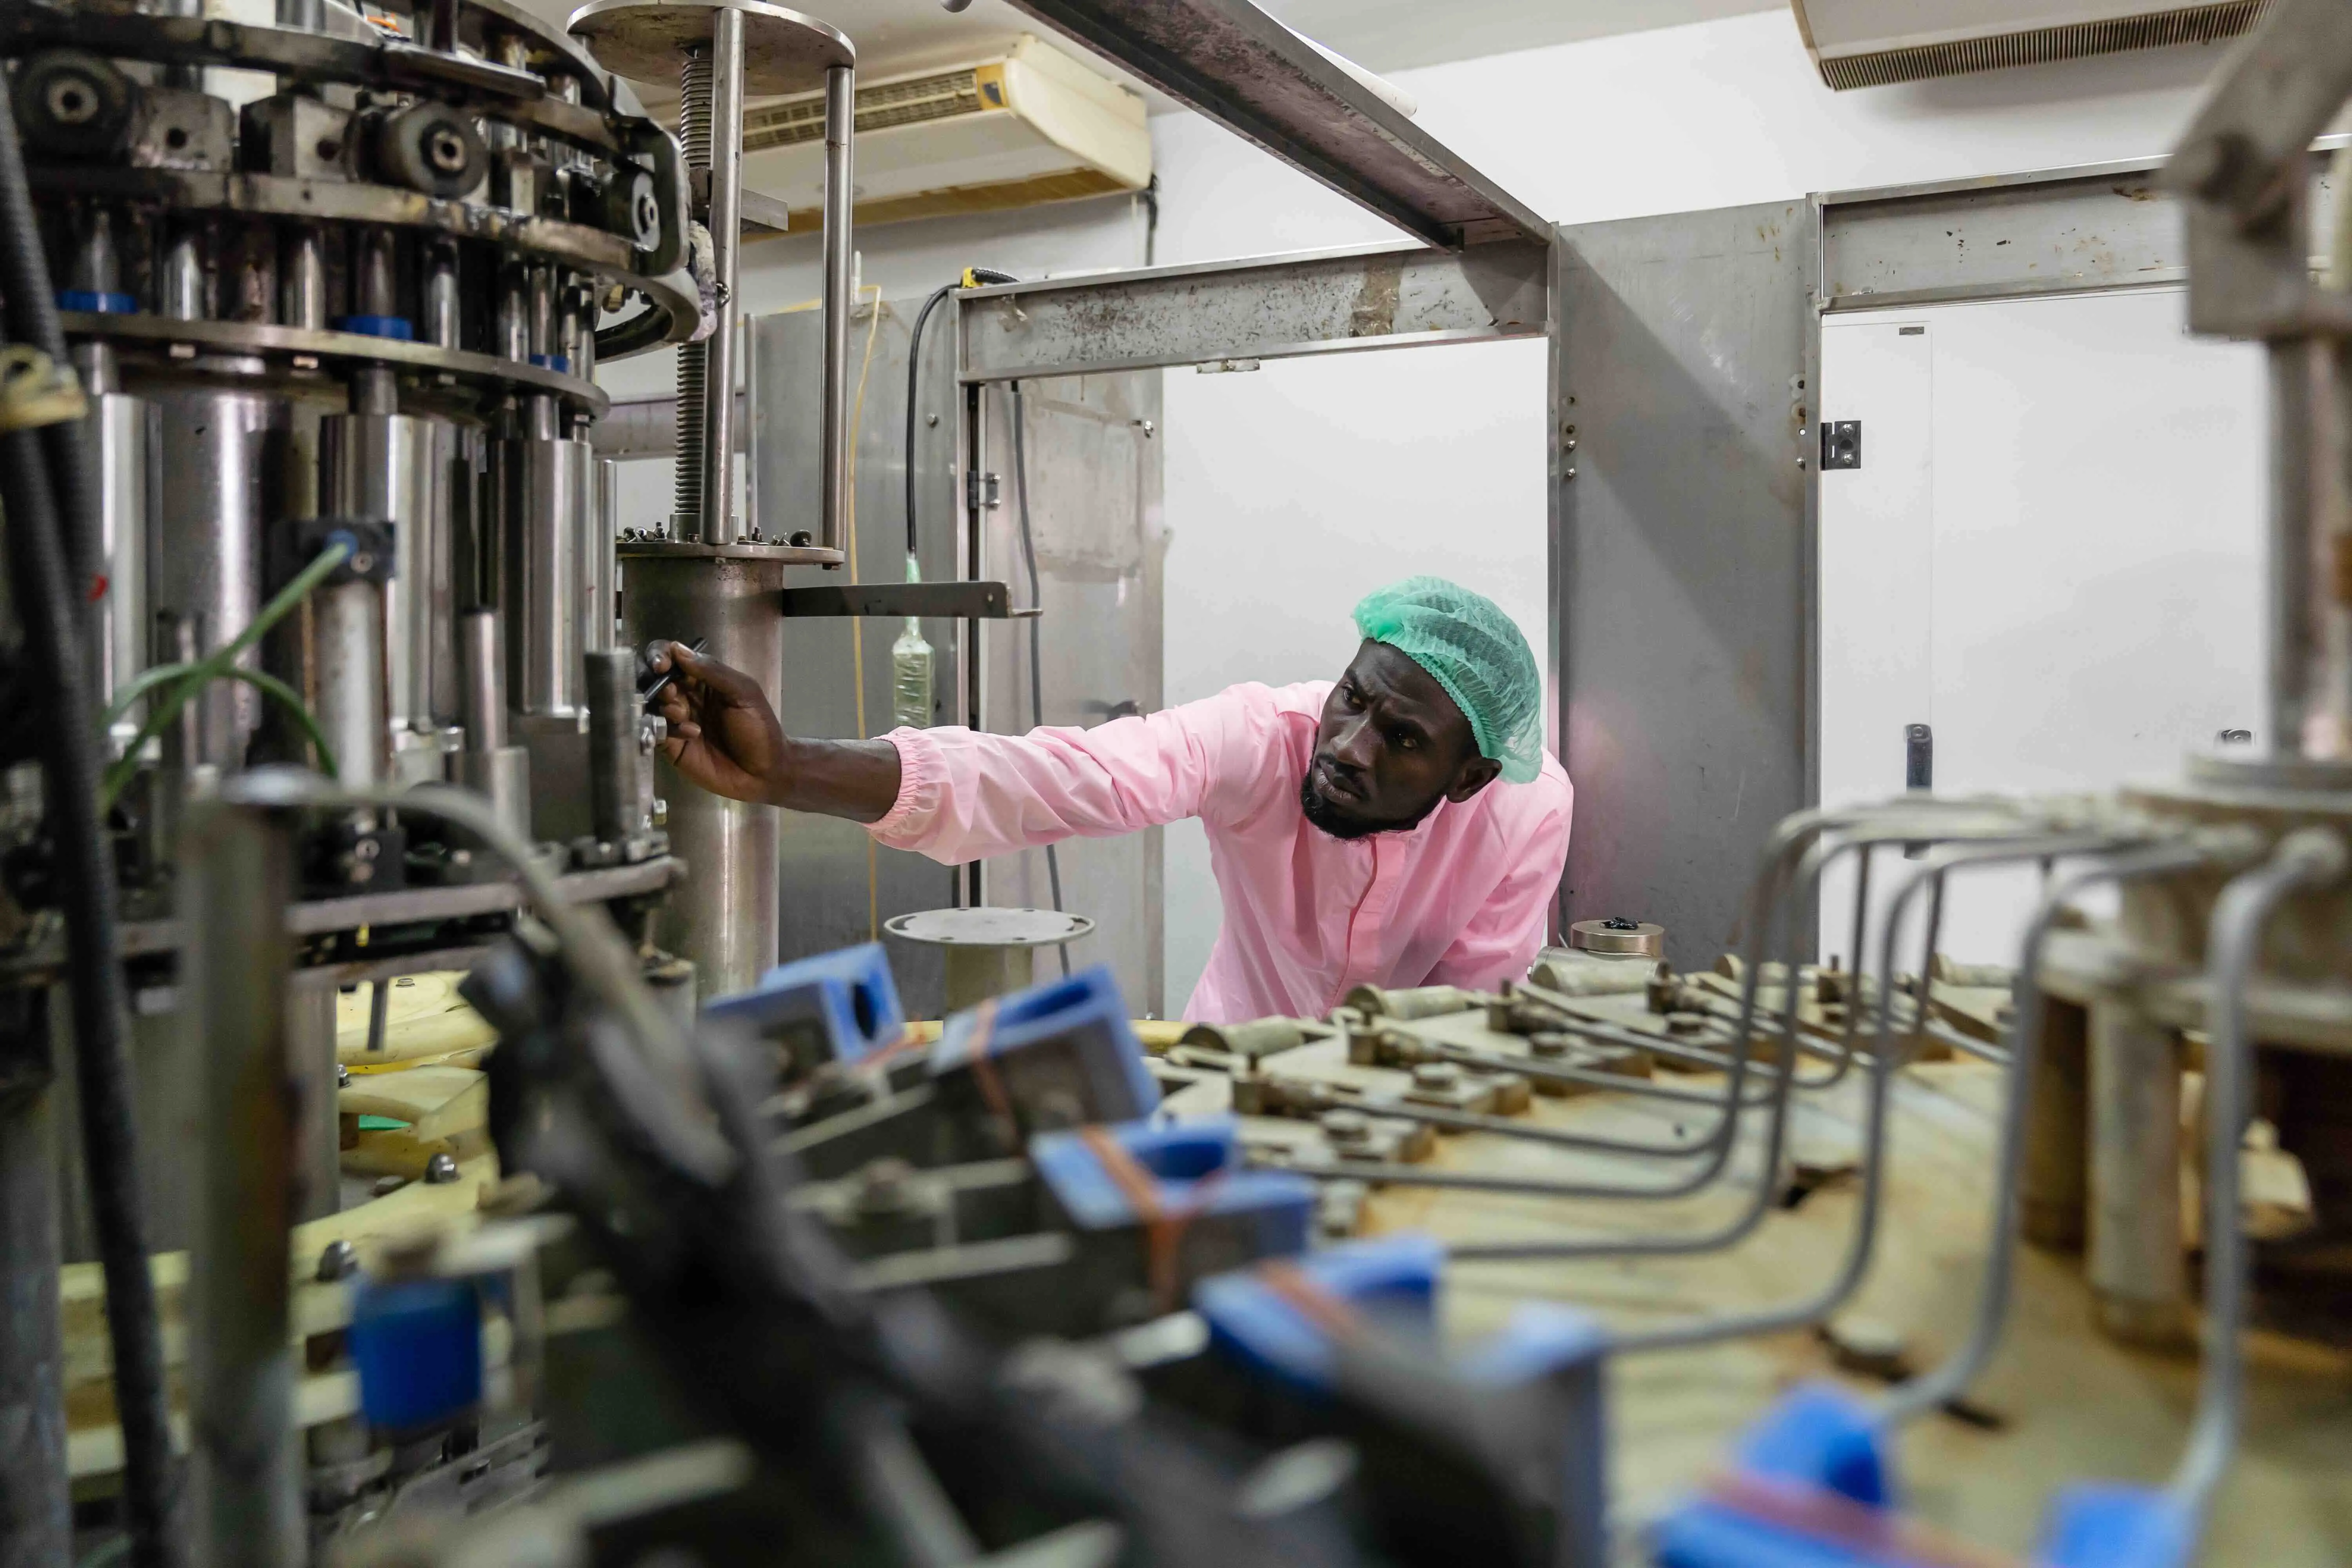
1) Corrective action workflow
Teams build the form and treat the action as a follow-on. It is not. Assignment, due dates, escalation on aging, reassignment, closure with evidence, and reporting on closure rate is a second application, and it is the one that determines whether the program works at all.
2) Audit-grade records
Attributable to a user on a shared device, timestamps that cannot be edited by anyone including an admin, evidence bound to the individual step, version control on the procedure, and retrieval across years. Most internal builds have two of those five, and discover the gap during an audit.
3) Multi-site variation
Site two always needs something different. If configurability was not designed in from the start, and it rarely is, every variation becomes a code change, and you now maintain branching logic for each plant.
4) Ownership continuity
The most predictable failure and the least planned for. Ask who maintains this in year three and what happens when they leave. If the honest answer is a name rather than a team with documentation and a budget line, that is your answer.
When building is genuinely the right call
There are four situations where building internally might actually make sense for your business.
- The process is unique to you. If you have a proprietary process that no vendor has encountered and that constitutes actual competitive advantage, buying a configurable platform means bending it into a shape it was not designed for. Building may fit better.
- Stable enough that it will not need constant changes - The program is something that has a long history, is optimized the way it is and you do not foresee it changing after digitization.
- The stakes are low and the scope is small. An internal tracker for something nobody will ever audit, used by twelve people at one site. Buying a platform for that is overkill.
- You have committed technical capacity to maintain it indefinitely. Not one developer. A team with on-call, documentation standards, and a roadmap. Organizations with genuine internal software capability can and do maintain internal tools successfully for a decade. If that describes you, most of the objections above are already solved.
What does not qualify: "we can save money" as the only reason. That is a year-one argument being applied to a five-year commitment.
The five-year cost comparison
Most build vs buy comparisons are dishonest because they compare a licence fee to a development estimate and stop. Here is a fuller frame.
Assumptions you should replace with your own:
- Fully loaded internal developer(s) cost (individual or team)
- The proportion of their time this consumes after launch
- Your own downtime and audit exposure
Nothing below is a claim about what your build will cost. It is a list of the lines that belong in the comparison and that get left out.
The line that flips most build cases is ongoing maintenance, because it is the only one that recurs and the only one that never appears in the original estimate. A build justified on a six-month development cost is being compared against a five-year subscription. Those are not the same thing.
The question underneath the question
Most build decisions are not really about software. They are about a plant that has been let down by enterprise software before and has concluded, reasonably, that it will get something better by making it itself.
That instinct is usually correct about the cause and wrong about the fix.
The reason the last platform failed is almost always that it forced the plant to redesign its processes to fit a template. Building your own solves that by making the software fit the process. But so does buying a platform that configures to your existing process rather than imposing one, and it does it without leaving you owning the maintenance.
When you evaluate, test that specifically. Ask a vendor to configure one of your actual forms, with your actual frequencies and your actual routing, and see whether they change your process to do it. That is the thing you were trying to protect by building.
What to do if you have already built something
Most plants in this position have something that works, and the decision is about the next three years rather than the last two.
- Keep it if it covers a genuinely unique process, it has an owner with capacity, offline and audit requirements are actually met rather than assumed, and it is not blocking anything.
- Migrate if it has become the thing nobody will change, the second site cannot use it, an auditor has already raised a question about it, or the person who built it has left or is leaving.
The realistic middle path, and what most plants actually do: keep the internal build for the one process it does well, and put the standard programs on a platform. This is not a failure of the build.
Sanitation, 5S, and quality checks are solved problems that thousands of plants run identically, and rebuilding them internally is spending your engineering capacity on the least differentiated work available.
One thing to check before you migrate anything: whether your data can leave the tool it currently lives in.
Data portability is the requirement people notice last and regret most. It applies to internal builds too, where the export path frequently means direct database access that nobody has documented.
The argument that has changed most recently
Build vs buy used to be mostly an economics question. There is now a data argument that did not exist five years ago.
In Weever's 2026 State of Data Capture in Manufacturing research, a survey of 167 manufacturing leaders at companies with more than 500 employees, 81% agreed that disconnected systems limit the effectiveness of AI across their operations, and 26% named disconnected systems as the single biggest factor hurting frontline data quality.
A homegrown app for one process, alongside three other tools for three other programs, is precisely that disconnection. The same failure gets described differently depending on which system caught it, and 51% of leaders in the same research said the same issue is frequently recorded differently depending on who logs it.
If your organization has an AI initiative, and 83% of those surveyed were deploying or piloting one, the frontline data underneath it either shares one set of conventions or it does not. That is a harder problem to fix with four internal builds than with one platform, and it is not a problem anyone was weighing in a build vs buy decision in 2021.
The honest summary

You can build it. Year one will probably go well. The question worth answering before you start is who owns it in year three, what happens when an auditor asks about version control, and what the second site does.
If you have good answers to all three, build it. If you have good answers to none of them, you are not choosing between building and buying. You are choosing between buying now and buying in three years after writing off a build.
Other factors that support building your own app are related to the use case you are digitizing. Is it genuinely unique to your operation, stable enough that it will not need constant change, low-stakes enough that an audit will never depend on it and you have committed technical capacity to maintain it indefinitely.
Weever configures to the process you already run rather than a template you have to adopt, which is usually the thing plants are trying to protect when they consider building. Site-based pricing, all frontline programs on one configuration, and data that stays yours and portable.
Want to test whether it fits your actual process? Book a demo and bring one of your current forms.
Frequently Asked Questions
Can I build my own connected worker app with Power Apps?
You can build a working digital checklist app. What typically breaks as it scales is offline reliability, corrective action workflow, audit-grade version control, multi-site variation, and ownership when the person who built it moves on.
Is building cheaper than buying connected worker software?
Usually in year one, often not over five years. The line that flips most build cases is ongoing maintenance, which recurs annually and almost never appears in the original estimate. A six-month development cost is not comparable to a five-year subscription.
When does building make sense?
When the process is genuinely unique to your operation, when you have a real platform team rather than one developer, when the stakes are low and nobody will audit the records, or when you need a stopgap while a proper evaluation runs.
What is the biggest risk with an internal build?
Ownership continuity. When the person who built it leaves, the undocumented knowledge leaves with them, and the tool becomes the thing nobody will change. The app does not fail, it becomes unmaintainable, which produces the same result more slowly.
Do internal builds pass audits?
Sometimes, and the gaps usually surface during the audit rather than before it. Audit-grade records need five attributes: attributable, uneditable timestamps, evidence bound to the step, procedure version control, and multi-year retrieval. Most internal builds have two or three.
We already built something. Should we scrap it?
Rarely all of it. The common path is keeping the internal build for the genuinely unique process it does well, and moving standard programs like sanitation, 5S, and quality checks onto a platform, since those are solved problems that do not differentiate you.
How does an internal build affect AI readiness?
A homegrown app for one program alongside other tools for other programs creates exactly the disconnection that limits AI. In Weever's 2026 research, 81% of leaders agreed disconnected systems limit AI effectiveness across their operations.
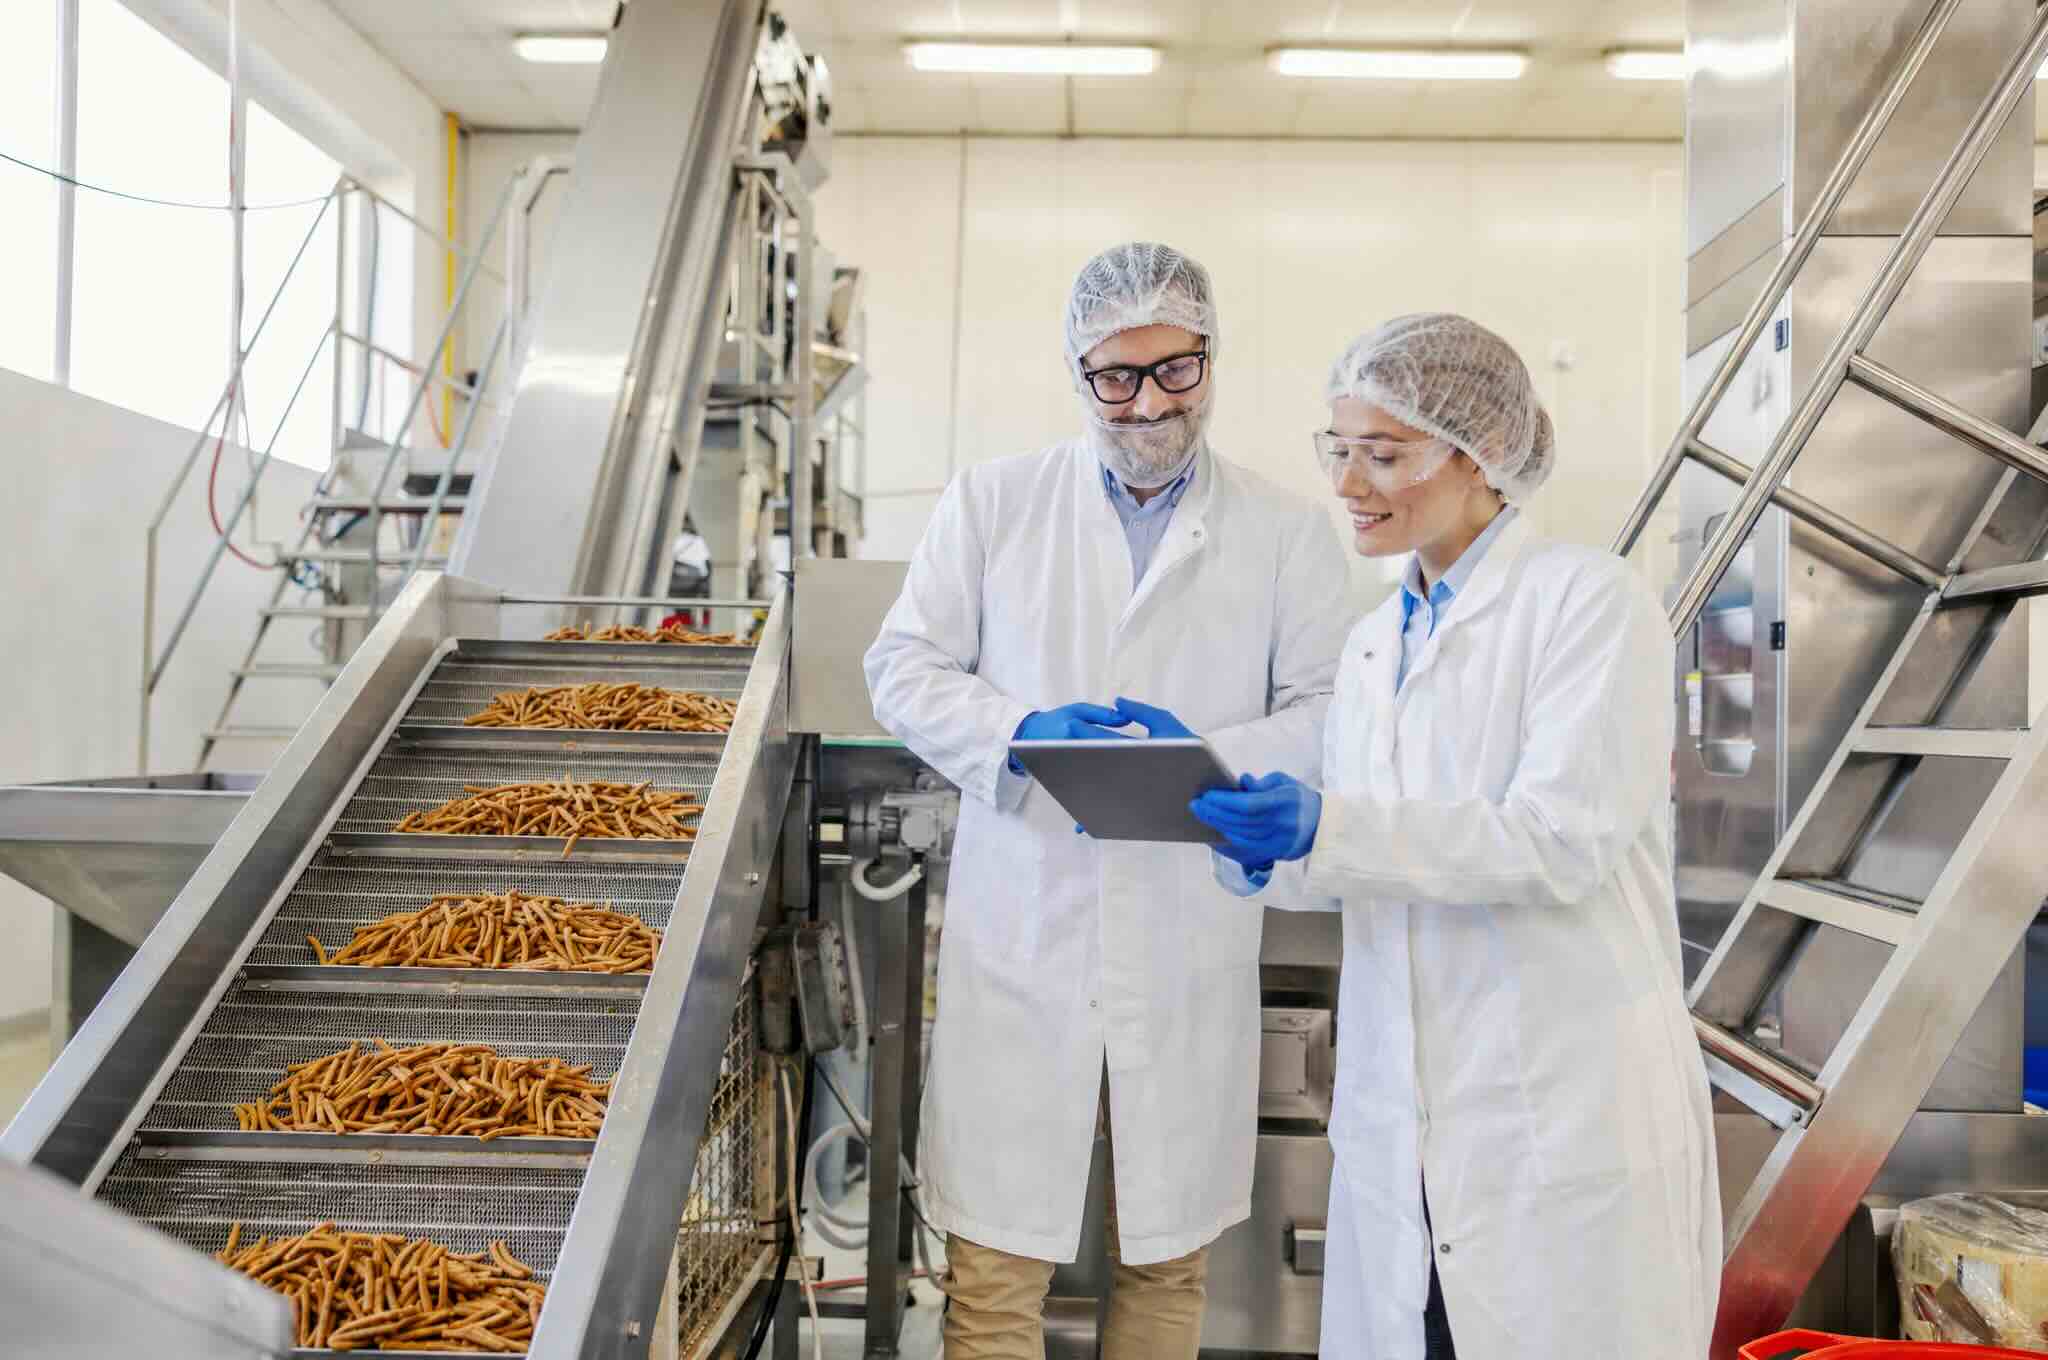
What to Measure After You Roll Out Connected Worker Software in Manufacturing: 12 KPIs That Matter
You went live a few months ago. Licences are issued, forms are built, and completion on the dashboard sits somewhere north of 90%. Leadership asks how the rollout is going and you tell them it is going well, because every number in front of you is up.
Then an auditor pulls a corrective action from March that nobody closed, and you realise you had no metric that would have told you it was sitting there.
That gap is in most post-rollout reporting. The numbers easiest to pull are the ones that would look good whether or not the program is working. Tasks completed, forms built: they climb after go-live, read as progress, but don't tell you whether something found on nights actually got fixed.
Measured well, your reporting tells you which shift has quietly stopped reporting problems, and it tells you before the audit does. Measured badly, it tells you nothing until somebody else finds the open action for you.
Here are the twelve metrics worth tracking after rollout, what each one catches, and the one that exposes the failure every other number on your dashboard will hide.
What should you measure after rollout?
Twelve metrics in four groups. Each metric is detailed below.
Adoption:
1) Active users per shift
2) Participation rate
3) Time to first task for a new hire
Execution:
4) On-time completion by shift and line
5) Task cycle time
6) Forms edited by plant admins
The Loop:
7) Findings volume per shift
8) Time from report to assigned owner
9) Corrective action closure rate
10) Age of oldest open action
Outcomes:
11) Hours reallocated to improvement work
12) Lagging indicators including downtime, defects, and audit findings.
If you track one, track corrective action closure rate. If you track two, add findings volume per shift, because that is the one that catches silent failure.
Why volume metrics mislead
Worth understanding before the list, because it explains why the obvious metrics fail.
Weever's 2026 State of Data Capture in Manufacturing research, a survey of 167 manufacturing leaders at companies with more than 500 employees, found 86% of organizations capture more frontline data than they did three years ago. And yet 62% still say important operational knowledge stays only in the experience of their operators, and 51% say the same issue is recorded differently depending on who logs it.
Capture went up across the board without any of those blind spots closing.
To illustrate the mechanism: your plant can go from 200 completed checks a month to 2,000, and every one of them can read "complete, no issues found." Volume grew tenfold. The number of recorded reasons why anything happened did not move.
Volume lands on every dashboard by default. Missing context is not measured anywhere, which is why the metrics below weight what was found and what was done about it over how much was submitted.
Adoption metrics
Adoption metrics answer one question: did the software reach the people it was bought for?
1. Active users per shift
Count the distinct people who actually completed something on each shift, not the licences you issued or the accounts you created.
Break it out by shift from day one. A plant-wide figure will look healthy while nights has quietly not adopted, and nights is usually where the problems are.
2. Participation rate
Active users as a percentage of the people who should be participating. This is the number that tells you whether you have a connected worker program or a supervisor reporting program.
If your platform charges per seat, this metric is capped by your licence count rather than by adoption, which is worth knowing before you read it as success.
3. Time to first task for a new hire
How long from a new person arriving to completing their first task unaided.
This is a proxy for usability that no demo reveals, and it matters disproportionately in high-turnover environments. If the answer is measured in days and involves a training session, your forms are too complex. A new hire should be able to scan a tag and work through a check without a supervisor beside them.
Execution metrics
Where adoption tells you people are using it, execution tells you whether the work is getting done the way it was designed.
4. On-time completion by shift and line
Measure the on-time completion rate of scheduled inspections and audits, and break it out by shift and line.
As an illustration of the pattern: a plant-wide completion rate of 94% is frequently 99% on days, 99% on afternoons, and 78% on nights. The average was concealing the only number worth acting on.
Adient, an automotive seating manufacturer we worked with, went fully paperless in under three months and lifted its 5S score from 85% to 97%.
5. Task cycle time
Measure how long a task actually takes, tracked over time. This metric will require you to actually measure the task time with a stopwatch before and after deployment.
There are 2 uses for this metric:
First, compare it to your old paper baseline. If the digital version is slower, that is a configuration problem and it will surface as an adoption problem within two months.
Second, watch for cycle time dropping suspiciously low, which can indicate people are completing forms without performing the checks.
6. Forms edited by plant admins
An unusual metric and a genuinely useful one.
If nobody at the plant has changed a form in six months, either your processes are frozen or your admins cannot edit forms without raising a ticket. The second is far more common, and it means your digital procedures are drifting out of date exactly as the paper ones did. A healthy program shows small, regular edits made by people in the plant.
Loop metrics: the ones that matter most
The first six metrics measure activity. These four measure whether the activity led anywhere, which is the only thing that separates a connected worker program from a very efficient way of filling in forms. They are the group most likely to deteriorate while every other number holds steady, so watch them as a set rather than individually.
7. “Action Item” Findings volume per shift
This is the most important diagnostic metric in the set, and the one almost nobody tracks.
Expect it to rise after go-live, and brief leadership on that before you launch. A rise in reported issues reads as deterioration to anyone who was not warned, and the instinct to react to it does real damage.
What you are watching for is the opposite: findings volume falling while completion stays flat. That is not a plant with fewer problems. That is a plant that has stopped telling you about them.
Our read on the mechanism, drawn from what we see in rollouts rather than from a survey question, is that when operators do not see their observations lead to changes, the quality of what they record decays. Completion holds, because completion is monitored. The detail of what was found thins out quietly, because nothing came of it last time.
A dashboard can report a program as healthy for months after the people using it have stopped telling you anything.
Completion sitting near 96% while findings drop by two thirds, to use an illustrative shape, is a failing program that every other number on the dashboard will report as fine.
8. Time from report to assigned owner
Should be effectively zero, because the system should create the action automatically.
If this metric is measured in hours, findings are sitting unassigned, which means a human is in the loop deciding what matters. That will break under pressure, and pressure is the normal state of a plant.
9. Corrective action closure rate
The single number to put in front of leadership.
Completion rate only proves the check happened. Closure rate proves that what the check found got fixed, which is the entire purpose of the program.
Mars Fort Smith, a pet food manufacturer we worked with, reached 100% task completion within a month of go-live and an 89% corrective action closure rate. Royal Canin, also in pet food, runs a 95% close rate.
Track it monthly, by program and by owner. Closure rate by owner is uncomfortable and useful, because a low rate concentrated on one person is usually a capacity problem rather than an attitude problem.
10. Age of oldest open action
Filter your action tracker and look for the oldest open action item. Why is it open?
Closure rate can look acceptable while a handful of difficult actions sit open for a year, because closing twenty easy ones offsets them.
Age of oldest open action surfaces exactly what a closure percentage hides, and it is usually the item that becomes an audit finding. Pair it with a count of actions open more than 30 days.
Outcome metrics
Outcome metrics are the ones leadership asked about when they approved the spend, and they are the slowest and least clean numbers in the set. Treat them as confirmation of what the loop metrics already told you months earlier, and be honest about attribution, because a plant that installed software may have also changed five other things that quarter.
11. Hours reallocated to improvement work
Track hours moved rather than hours saved, and give them a named destination.
Measure the administrative time that has come out of the process, then track where it went: corrective action closure, Gemba walks, operator coaching, the centerline audits that used to get skipped. Report the destination alongside the number, because the destination is the part leadership can act on.
Measure it rather than estimating it. Time a supervisor's end-of-shift work for a week before go-live and again at 90 days. Estimates run low because retyping does not feel like work, it feels like the end of the shift.
12. Lagging indicators: downtime, defects, and audit findings
Downtime events, hold and scrap volume, safety incidents and near miss ratio, and audit findings per audit.
These are the numbers leadership actually cares about, and they are the last to move. Expect two quarters before a trend is credible, and be careful about attribution, because plants change many things at once.
The honest framing: leading indicators tell you whether the program is working, and lagging indicators eventually confirm it. Do not promise movement in lagging indicators inside a quarter, because you will be held to it and it will not happen.
What good tends to look like at 30, 90, and 180 days
Directional targets, drawn from observed rollouts rather than a formal study. Use them as a sanity check rather than a benchmark.
The row that matters most is oldest open action. It should be under 30 days at every stage, and if it is not under 30 days at day 30, it will not be at day 180.
How to build a monthly review people actually attend
The mistake is creating a new meeting. New meetings about software metrics do not survive a busy quarter.
Put two numbers into a meeting that already exists, usually your daily or weekly production meeting: open actions by age, and findings volume by shift. Ten minutes.
The value is not the review itself. It is that your supervisor now has a reason to have looked before they walk in, which is what lets them tell an operator that the thing they reported got fixed. That single conversation is the mechanism keeping findings volume up.
Then run a genuine monthly review with four questions:
- Which shift or line has the lowest completion, and why?
- What is the oldest open action, and who owns it?
- Which failure has recurred most this month?
- Where did the recovered hours actually go?
Question 3 is where continuous improvement starts. A recurring failure on the same asset is a specification, training, or design problem rather than a discipline problem, and it only becomes visible when every instance was recorded the same way.
The metrics not to track
Worth naming, because they consume attention and mislead.
Every metric in the left column counts activity. Every metric in the right column checks whether the activity produced anything. The ones on the left all rise after go-live regardless of whether the program is working, which is exactly why they get reported.
Why manufacturers choose Weever
Reporting built around the loop
Weever reports on completion, findings, and closure by program, shift, line, and site. The four questions in the monthly review above are a filter you apply to reporting that already exists, rather than a data-gathering exercise somebody has to prepare for.
Plant admins own their forms
Admins at the plant edit forms directly, without raising a ticket. That is what keeps KPI 6 healthy, and it is the difference between digital procedures that stay current and digital procedures that drift out of date the way the binders did.
Live in weeks, not months
Adient went fully paperless in under three months. Mars Fort Smith hit 100% task completion within a month of go-live. You are measuring a real program inside a quarter rather than waiting on a phased implementation.
Priced by site, not by seat
Weever licenses by site. Every operator on every shift can participate, so your participation rate measures adoption rather than how many seats you bought. That matters more than it sounds, because the metric in KPI 2 is worthless if licence count is what caps it.
Start with two numbers
The programs that last are the ones where reporting visibly leads to fixing, and every metric above is a way of checking whether that is still true in your plant this month.
Want to see what your current reporting is not showing you? Book a demo.
Frequently Asked Questions
What KPIs should we track after implementing connected worker software?
Active users per shift, participation rate, time to first task for a new hire, on-time completion by shift and line, task cycle time, forms edited by admins, findings volume per shift, time to assigned owner, closure rate, age of oldest open action, hours reallocated to improvement work, and lagging indicators.
What is the single most important metric?
Corrective action closure rate. Completion rate only proves the check happened. Closure rate proves what the check found actually got fixed, which is the purpose of the program. Pair it with age of oldest open action, which closure percentages can hide.
Should reported issues go up or down after go-live?
Up. People are recording things that previously went unwritten. Brief leadership before launch so the rise is not misread as performance deteriorating. Findings volume falling while completion stays flat is the warning sign, not the reverse.
How do we know if adoption is failing?
Watch findings volume per shift against completion rate. If completion holds near its target while findings drop sharply, operators are completing checks without recording what they find, which is what happens when reporting has visibly led nowhere.
How long before we see improvement in downtime or defects?
Two to three quarters before a trend is credible, and attribution is difficult because plants change several things at once. Leading indicators tell you the program is working. Lagging indicators confirm it later. Avoid promising lagging movement within a quarter.
Why is capturing more data not enough?
Because volume and context are different things. Weever research found 86% of organizations capture more frontline data than three years ago, while 62% still say key operational knowledge stays only with their operators. Two thousand checks reading "no issues found" add volume and no understanding.
How should we report these to leadership?
Put open actions by age and findings volume by shift into a meeting that already exists rather than creating a new one. Ten minutes. The value is that supervisors have a reason to have looked, which is what lets them close the loop with the person who reported.
How do we measure hours recovered credibly?
Time a supervisor's end-of-shift administration for a week before go-live and again at 90 days rather than asking for estimates, which run low. Then track where those hours went. Capacity recovered without a named destination is not a result you can report.

How to Build the Business Case for Connected Worker Software in Manufacturing
If you are putting together a business case for connected worker software, you have probably already heard the first objection. Paper is cheap. Nobody approves a six-figure software purchase to stop buying clipboards.
The second objection is quieter and does more damage. If the case is built on cutting people, it sometimes gets approved, and then the rollout stalls, because a program that depends on your team reporting what they see does not survive being introduced as a headcount exercise.
The same business case reads very differently when it's built on an increase in capacity and employee engagement. Your plant already employs people who know how to improve it, and most of them lose part of every shift to transcription, chasing, and compiling reports. This process can be automated with connected worker software and their time can be reallocated to more value added activities.
This guide walks through the three steps that turn an idea into an approved budget: measuring current process costs, identifying recovered capacity, and estimating the value a connected worker platform rollout would generate.
What structure gets a connected worker business case approved?
Step 2 is the one most business cases skip, and it is what separates a capacity-oriented business case from one built around cost reduction only.
- "We will recover 400 hours a year" invites the obvious follow-up question about who you plan to let go.
- "We will recover 400 hours a year and put them into closing the corrective action backlog and running the centerline audits that currently get skipped" does not.
Step 1: How to measure what your current process costs you
Start with the issues and the waste, because this is the part of the case you can prove in your own plant this week.
The cost is rarely in performing a check. It sits in everything around it: the transcription at the end of the shift, the three people chased to find out whether last week's finding was closed, the weekly report rebuilt by hand, and the same data rekeyed into a second system.
Then there are the issues that never close, the failures that keep coming back, and the checks signed off from memory because the shift ran long.
1. List every frontline program and its paper trail
Write down each program that runs on paper or spreadsheets: sanitation, autonomous maintenance CILs and centerlines, quality checks, safety observations, 5S audits. For each one, note where the record goes after it is filled in and who touches it next. That handoff chain is where most of the waste lives.
2. Time the administration for one week
Pick one supervisor per shift and time their end-of-shift administration for a full week. Do not ask them to estimate it. Estimates run low, because retyping a checklist does not feel like work. It feels like the end of the shift.
3. Add report compilation and rekeying time
Ask whoever builds the weekly and monthly reports how long each one takes. Add any time spent entering the same data into a CMMS, ERP, or quality system. Multiply everything across shifts and weeks to get annual hours.
4. Audit your open issues
Count open findings and corrective actions, find the oldest one, and ask for your current corrective action closure rate. In many plants, nobody can answer the last question. That gap is itself the finding, and it costs nothing to put on your first slide.
5. Pull twelve months of repeat failures, holds, and scrap
Ask quality or finance for every hold and scrap event from the last twelve months. Flag the ones that trace back to a check that was late, skipped, or completed from memory. Do the same for repeat equipment failures on the same asset.
6. Count audit preparation days
List every internal, customer, and regulatory audit from last year, the preparation days each one took, and how many people were pulled off their normal work to prepare.
7. Summarize it on one page
The output of Step 1 is a current-state cost sheet: annual administrative hours, open issues and their age, repeat failures, hold and scrap events, and audit preparation days. Keep hours as hours. You will not convert them into labour dollars, because Step 2 is about where those hours go, not what they cost.
Mars Yorkville freed up 13 hours a day previously spent administering quality checks and now runs those checks 400% faster. Those hours went back into the operation, not out of it.
Step 2: How to name where the recovered capacity goes
A number without a destination reads as a headcount argument, whether you intended it or not. This step makes the destination explicit.
1. Ask your operations leader what is currently being skipped
Every plant has work that gets pushed to next week because the shift ran out. Common answers: the corrective action backlog, centerline audits, Gemba walks, operator coaching, and continuous improvement projects that never get started. Write down the actual list for your plant, not a generic one.
2. Assign each block of hours to a named destination and owner
Take the annual hours from Step 1 and allocate them. "Supervisor end-of-shift hours go to daily corrective action review, owned by the production manager" is the level of specificity you want.
3. Account for the improvement work that data makes possible
Continuous improvement is where redirected capacity compounds, and it is usually starved of data more than commitment. A CI cycle needs consistent, comparable records over enough time to see a trend. Paper does not produce that, so many improvement projects spend their first month rebuilding a dataset from binders.
In Weever's 2026 State of Data Capture in Manufacturing research, a survey of 167 manufacturing leaders at companies with more than 500 employees, 51% said the same issue is frequently or very frequently recorded differently depending on who logs it. You cannot run a Pareto on data like that.
Count the improvement projects your plant ran last year that needed someone to assemble historical data by hand first, and estimate what share of project time that took. That time is part of the capacity you are redirecting.
4. Link every destination to an outcome
Each destination should point to at least one outcome in Step 3. Corrective action closure links to availability and compliance. Centerline audits link to performance and quality. Near miss follow-up links to safety. If a destination links to nothing, drop it from the case.
5. State the no-headcount position in writing
Put one sentence in the case that says it plainly: recovered hours are redeployed to improvement work, not removed. It protects the rollout, and it stops the case from being summarized as a labour cut by anyone who reads only the first page.
Why participation scales every number in the study
Every line in Step 3 scales with how many people are reporting, which makes the pricing model a business case issue rather than a procurement detail.
Per-seat licensing puts a price on participation. Plants respond by limiting accounts to supervisors and leads, so the people closest to the equipment cannot record what they see, and the program underperforms its forecast. Site-based pricing with unlimited users removes that decision.
Closure rate is the number that shows participation turning into outcomes. Mars Fort Smith reached 100% task completion within a month of go-live and an 89% corrective action closure rate. Royal Canin, a pet food manufacturer we worked with, runs a 95% close rate.
Step 3: How to build an estimated value impact study
Step 3 connects the redirected capacity to the outcomes your leadership already tracks. The study does not need to be precise. It needs to be conservative, built on your own numbers, and clear about what is an estimate.
Orient business case claims around Prevented Events, not percentages.
- "If this prevents four stoppages a year, it pays for itself twice over" is defensible
- "This will improve OEE by 15%" invites an argument you cannot win in the room.
Keep capacity estimates in hours and put dollar values only against risk events such as downtime, incidents, and holds.
1. Get your unit costs from finance
You need four numbers: downtime cost per hour (from throughput, margin, idle labour, and any contractual penalty), cost per recordable safety incident (from your insurer or finance team), average cost of a hold or scrap event, and the preparation days per audit you counted in Step 1. Finance can usually produce the first three in an afternoon.
2. Estimate the OEE impact
Connected worker software touches all three OEE factors, which makes this line worth putting in front of an operations leader as well as a finance one.
For the estimate, take your unplanned stoppages from the last twelve months, identify the ones that had a visible warning sign an operator could have reported, and claim a conservative share of those as preventable. Multiply by average stoppage length and your downtime cost per hour.
3. Estimate the safety impact
Safety observations and near miss reports are leading indicators, and their value depends on volume. If submitting a near miss takes four minutes and a login, most never get submitted. If it takes twenty seconds on a phone at the point it happened, they do.
Pull three years of incident and near miss volumes from EHS. Estimate how many incidents had a precursor that somebody saw and nobody recorded, and multiply a conservative share of those by your cost per recordable.
If your insurer or finance team cannot give you a cost per recordable, use a published benchmark. The National Safety Council's Injury Facts puts the average cost of a medically consulted work injury at $48,000 in 2024. Your own figure is still the stronger number in the room, so treat the benchmark as a starting point rather than a substitute.
4. Estimate the compliance impact
Auditors increasingly want proof a procedure was executed, by whom, when, and against which revision. Paper struggles with all four: signatures are hard to attribute, timestamps can be backfilled, version control depends on the right revision being in the binder, and retrieval means days of pulling files.
Estimate this line in three parts, none of which require you to price a fine:
- Preparation capacity. Audit events per year, multiplied by preparation days and people involved. This is capacity, so it belongs in hours alongside Step 1.
- Findings and closure work. Last year's findings and the effort each one consumed.
- Exposure. Name the consequence rather than pricing it. For most food and beverage plants that is a failed customer audit and the commercial impact of being suspended by a retailer, which your commercial team can size better than any benchmark.
Adient, an automotive seating manufacturer we worked with, went from more than 60 open issues a month to fewer than 5 and lifted its 5S score from 85% to 97%, going fully paperless in under three months.
5. Estimate the reduced risk from holds, recalls, and scrap
This is the tail risk, where the numbers are largest and least predictable. The mechanism is check reliability. Every plant has a sanitation schedule and an allergen changeover procedure. An investigator asks whether they were followed on the specific date in question, and whether you can prove it.
The stakes are high. In the Grocery Manufacturers Association's Capturing Recall Costs study, produced with Ernst & Young and Covington & Burling, 77% of companies that had faced a recall in the previous five years estimated the financial impact at up to $30 million, and 23% reported even higher costs.
Take the twelve months of hold and scrap events from Step 1. For each, ask whether an in-process or pre-op check performed on time, with evidence, would plausibly have caught it. Claim a small share. A small fraction of your annual hold cost is usually still a large number, and it is credible in a way a large fraction is not.
6. Add the cost of doing nothing
Most business cases leave this out, and it is often the strongest line in the study. Your organization is probably already funding operational AI. In the Weever research, 83% of organizations were deploying or piloting AI in manufacturing operations, with half deploying across production now. And 73% of those same leaders said limited trust in frontline data is already preventing their organization from relying on it.
77% of leaders in the same research say manual and paper-based processes are what prevent frontline data from being AI-ready. That moves part of the conversation from new spend to protecting spend already committed.
7. Put it on one page and sanity-check it
Lay out each value line with its inputs, its formula, and a conservative estimate. Run the ROI calculators for sanitation, autonomous maintenance, and 5S as a cross-check. They will not replace your plant's data, but they will tell you quickly whether the shape of the case holds up.
The Checklist: the numbers to pull before you write the case
If your closure rate turns out to be unknown, lead with it. It is the clearest single illustration of the problem you are asking to fix.
Why manufacturers build this case with Weever
Built for frontline programs. Weever runs sanitation, autonomous maintenance, quality checks, safety, and 5S for food, beverage, and CPG manufacturers, on one configuration.
Priced for participation. Site-based pricing with unlimited users, so the value lines in your study are not capped by how many accounts you can afford.
Live in weeks. Weever is configured to the process you already run, with hands-on onboarding and implementation, so the case does not depend on a long rollout before any value shows up.
Build your case on capacity and risk
A business case built on paper savings or headcount stalls. One built on measured waste, named destinations, and conservative value estimates gets approved and survives the rollout.
Want help building the value impact study against your own operation? Book a demo and bring your Step 1 numbers.
Frequently Asked Questions
What is the ROI of connected worker software?
The return comes from capacity redirected from administration to improvement work, plus OEE gains across availability, performance, and quality, fewer safety incidents, lower compliance and audit exposure, and fewer holds, recalls, and scrap events. Estimate it with your own downtime, incident, and hold costs rather than industry percentages.
Does connected worker software reduce headcount?
That is not the case to build. The value is in redirecting hours currently spent on transcription, chasing, and compiling into improvement work your team is already qualified to do. A program that depends on people reporting what they see does not survive being introduced as a headcount exercise.
How do I justify connected worker software to a CFO?
Use three steps. Measure what your current process costs in issues and waste, name specifically where the recovered hours go, and present an estimated value impact study built on prevented events and your own unit costs.
What should a value impact study include?
Each value line (OEE, safety, compliance, and hold, recall, and scrap risk) with its inputs, where each input comes from, the formula, and a conservative estimate. Keep capacity in hours and apply dollar values only to risk events.
How does connected worker software improve OEE?
It affects all three factors. Availability improves through faster abnormality reporting and resolution, performance through fewer minor stops and cleaner changeovers, and quality through in-process checks that catch drift before it becomes a defect.
What should I measure before implementing?
Supervisor administrative hours, report compilation and rekeying time, open issues and their age, your current corrective action closure rate, twelve months of hold and scrap events, incidents and near misses, audit preparation days, and downtime cost per hour.
Why does the pricing model affect the business case?
Every value line scales with participation. Per-seat licensing leads plants to limit accounts, usually excluding the frontline staff doing the observing. Site-based pricing with unlimited users removes that ceiling.
10 Connected Worker Use Cases in Manufacturing (and Which One to Digitize First)
Most plants do not buy a connected worker platform for ten programs. They buy it for one, it works, and eighteen months later it is running six. As a result, where you start is very important. Start with the wrong program and you spend 3 months configuring something nobody was asking for. Start with the right program and the second one gets approved on the strength of the first.
This article covers the ten programs that belong on a connected worker platform, and then gives you a method for choosing where to start that is not "whichever one is easiest to configure."
Which programs belong on a connected worker platform?
There are 3 factors to consider when determining if your program should be included within the score of your Connected Worker platform.
Programs meeting all 3 are where the return is. Programs meeting 2 are worth doing second.
1. Autonomous maintenance, CILs, and centerlines
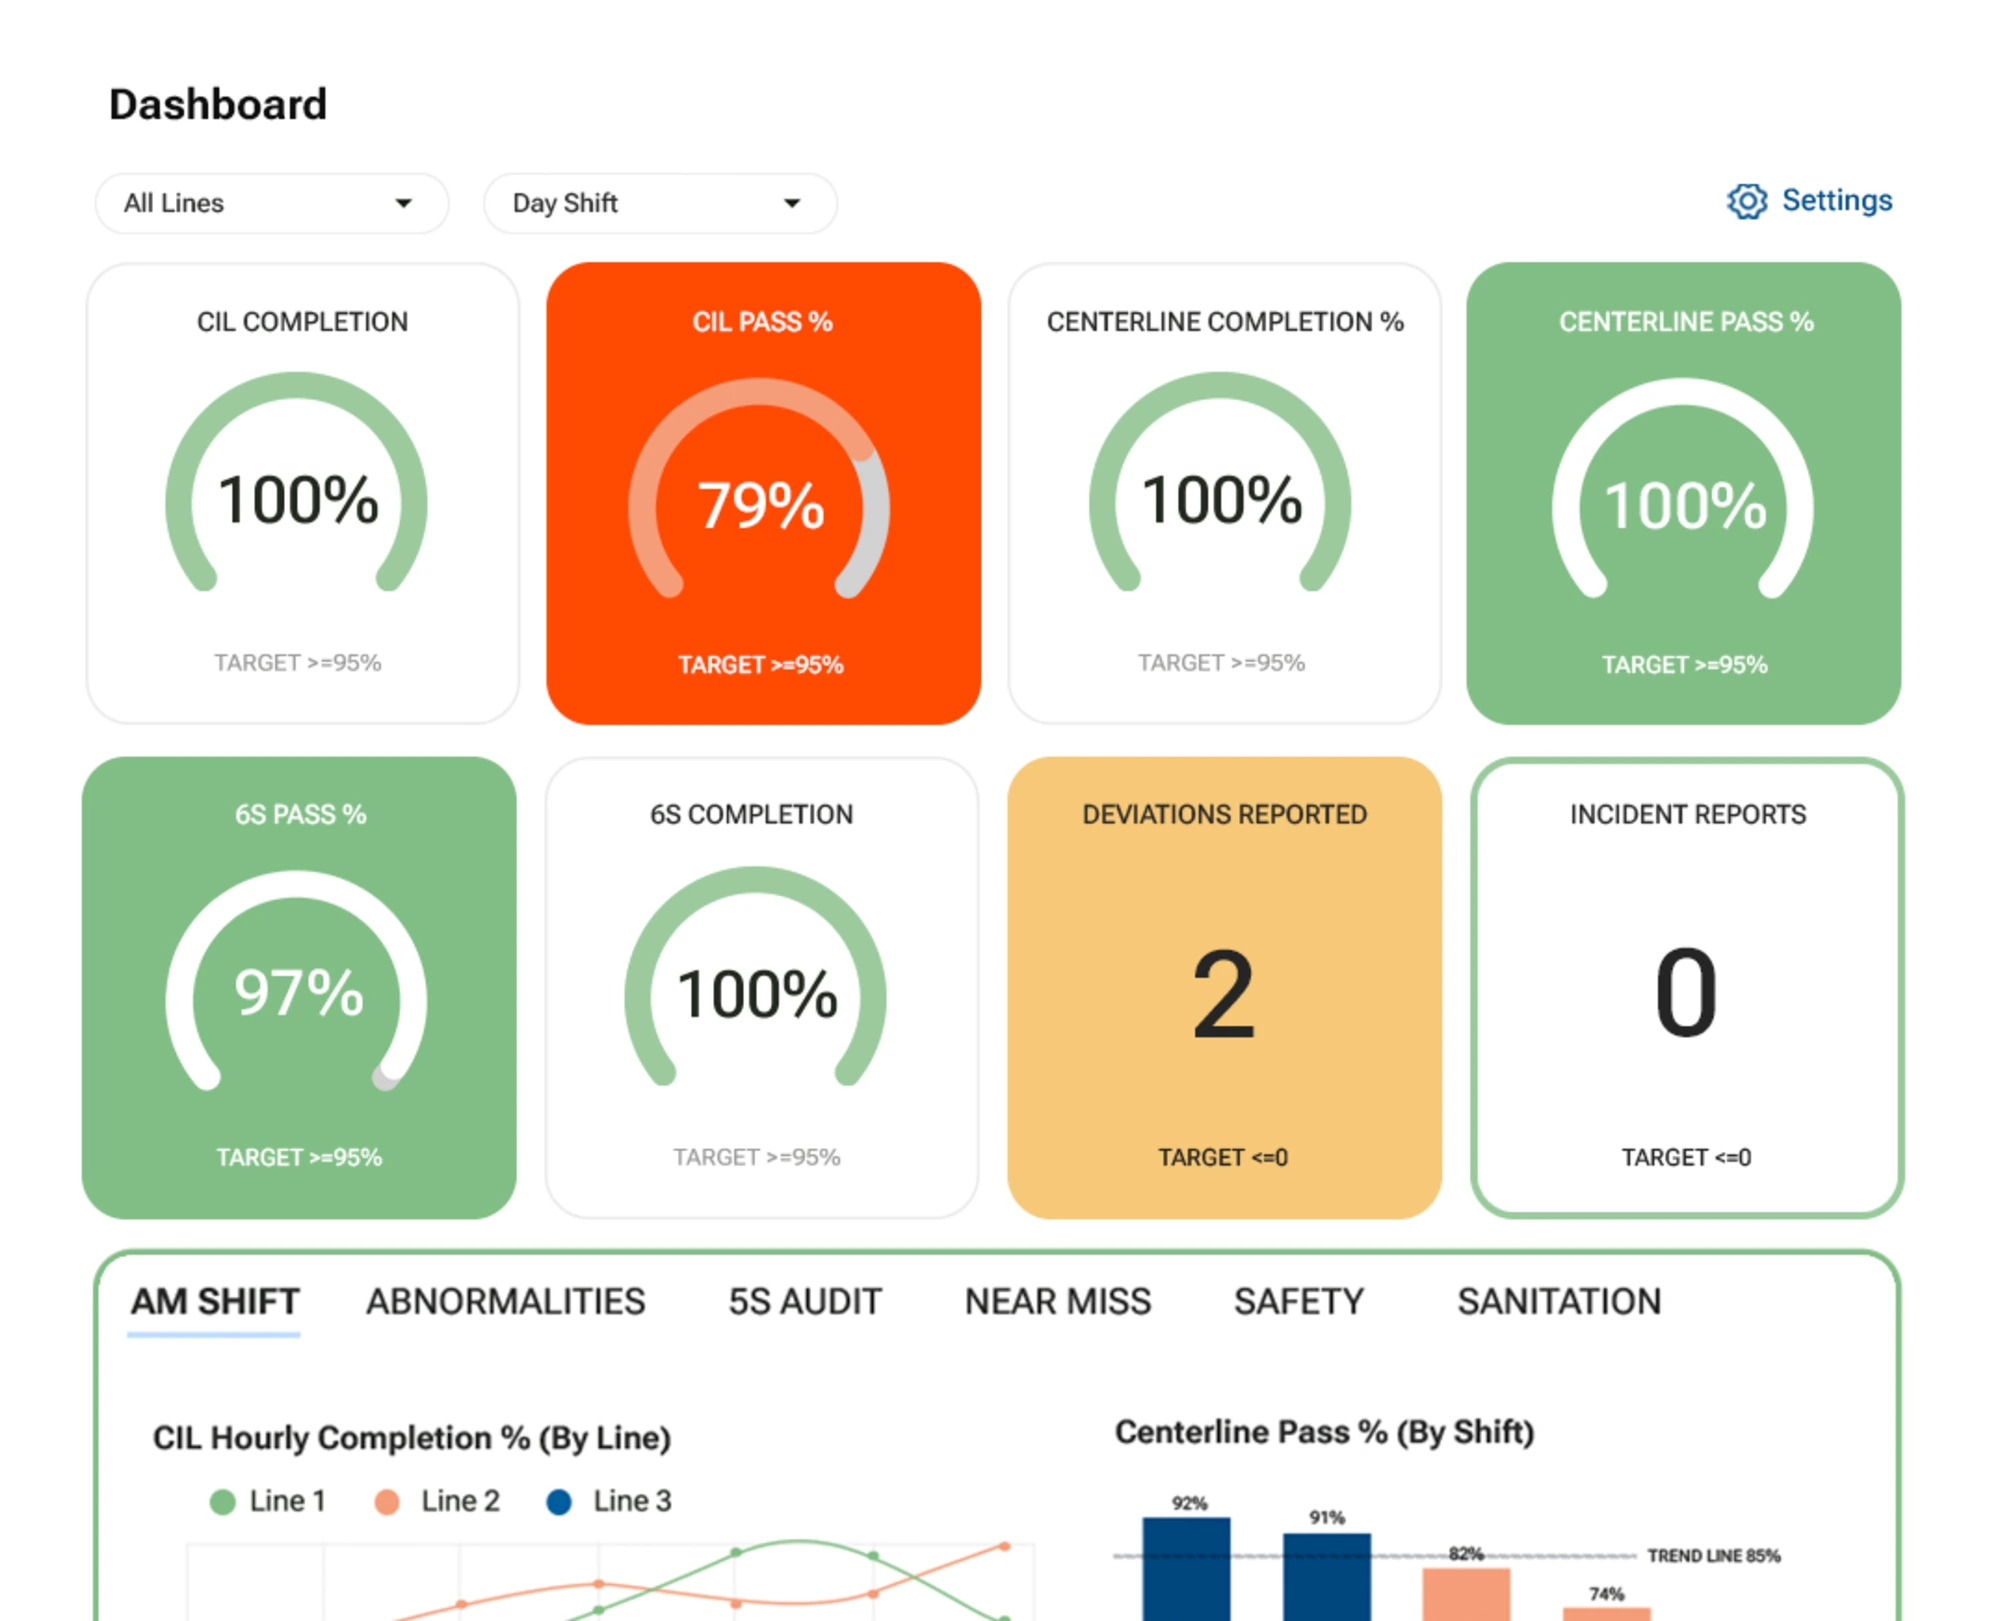
Operator-performed CIL (clean, inspect and lubricate) work, plus centerline verification, is the largest single use case in most manufacturing plants.
It is also the one that most obviously cannot live in a CMMS. Autonomous maintenance is by definition performed by people whose job title is not maintenance. They will not be given CMMS licenses and would not use the interface if they were, which is why AM rounds sit on paper in plants with fully digital maintenance functions.
What changes: the round is completed at the machine, abnormalities create owned actions immediately, and the fourth occurrence of the same abnormality on the same asset becomes visible as a pattern instead of a fourth separate note.
Solutions page: Autonomous Maintenance
2. Master sanitation schedules and SSOPs
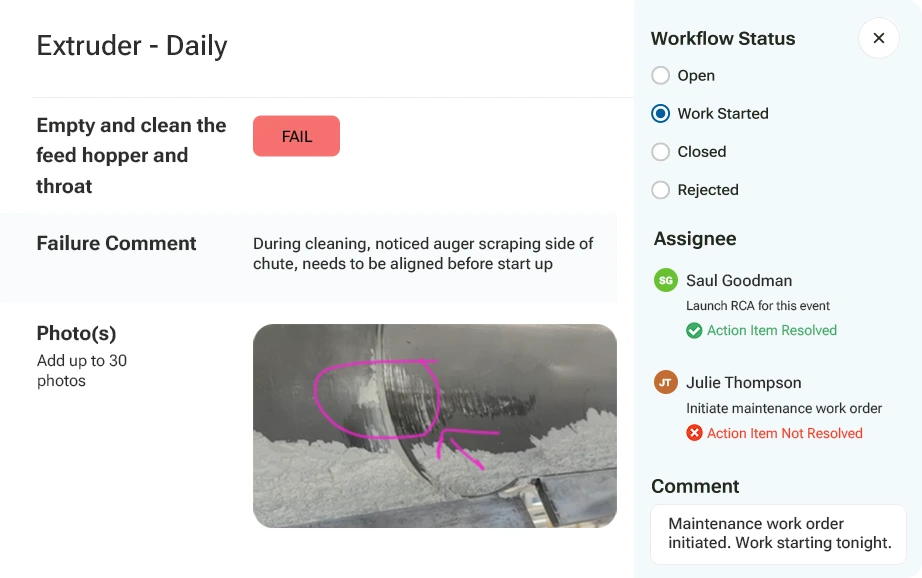
Sanitation is scheduled, evidenced, and audited, which makes it close to a perfect fit.
The paper version fails in a specific way: the schedule lives in one place, the completion records in another, and the corrective actions from a failed pre-op in a third. Proving that a specific clean happened on a specific date to a specific standard means assembling three sources, which is exactly what an auditor asks you to do under time pressure.
Digitized, the schedule generates the task, the task captures photo evidence at the step, and a failed pre-op creates an action before start-up rather than a note that gets read on Thursday.
Solutions page: Master Sanitation Schedule
3. Quality and in-process defect checks
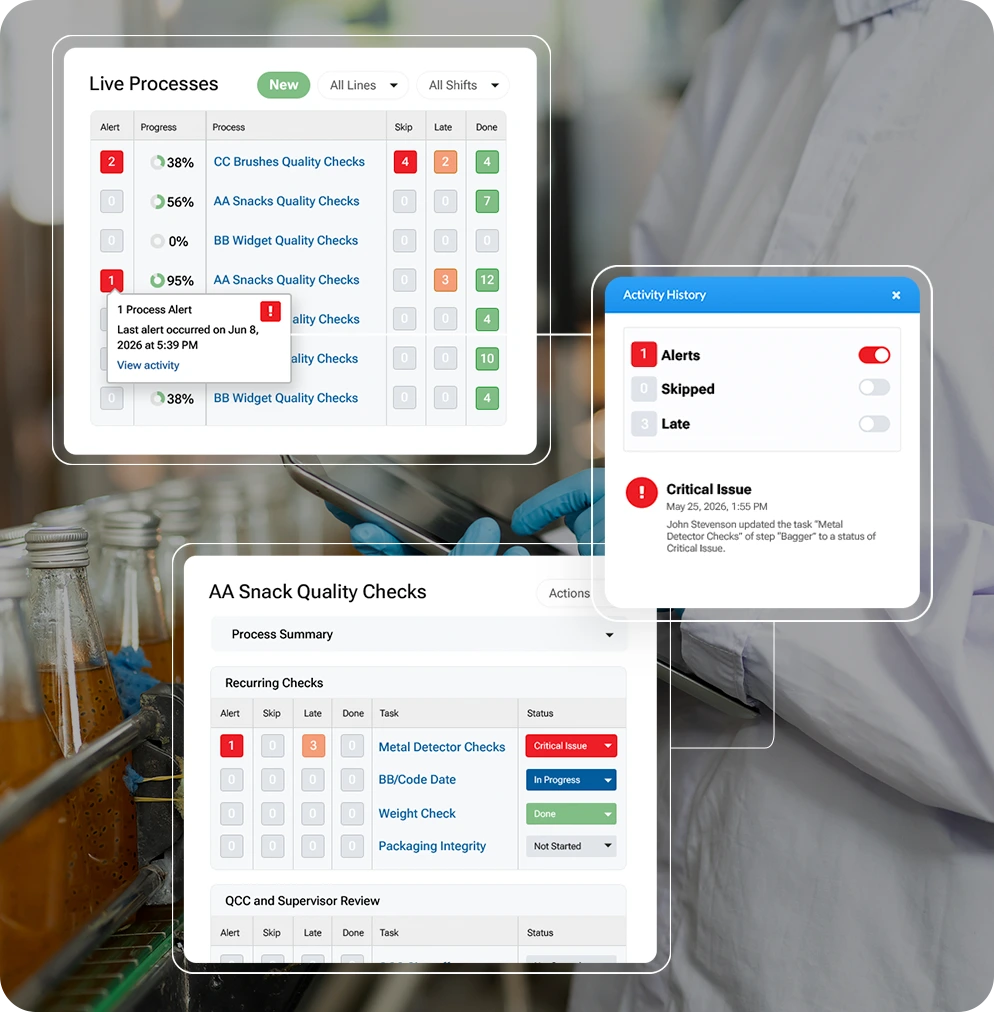
Hourly checks, start-up and changeover verification, net weight and fill checks, date code and label verification, CCP (Critical Control Point) monitoring, and sensory checks.
These are high-frequency and low-ceremony, dozens per shift, which is exactly why they do not belong in an eQMS. Putting a 10:00 net weight reading through quality management workflows is like filing a change request to adjust a torque setting.
Mars Yorkville runs quality checks 400% faster and freed up 13 hours a day previously spent administering them. [attach case study link]
Solutions page: Quality Checks
4. Safety observations, near misses, and hazard reporting
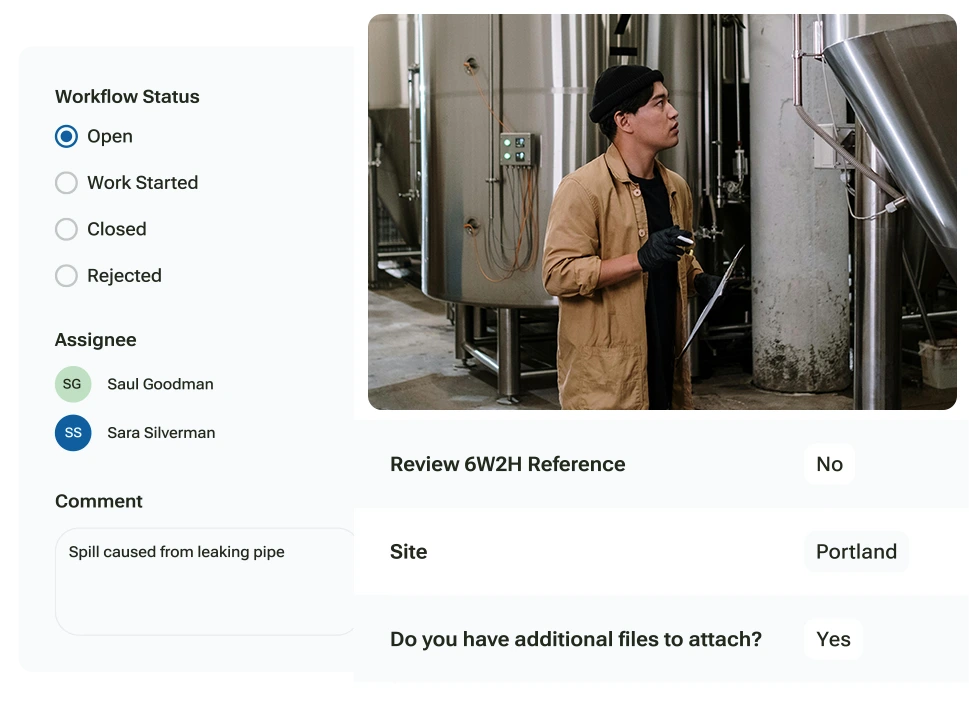
Behaviour-based safety observations and near miss reporting are leading indicators, and their entire value depends on volume.
That makes friction the enemy. If submitting a near miss takes four minutes and a login, you will capture a small fraction of the near misses that actually occur, and your leading indicator data becomes a measurement of who has time to fill in forms rather than what is happening in the plant.
This is also the clearest case against per-seat licensing. Charge for participation and plants ration it, usually starting with the people furthest from the office.
Solutions page: Safety
5. 5S and 6S audits
Scored audits with photo evidence and tracked findings, which is a workflow paper handles badly and spreadsheets handle worse.
The failure mode is consistent scoring. When three auditors score the same zone from a paper rubric, you get three different numbers and no way to tell whether a change over time is real improvement or a different auditor. Structured scoring with photo evidence removes most of that variance.
Adient lifted its 5S score from 85% to 97% and cut open monthly issues from more than 60 to fewer than 5, going fully paperless in under three months. [attach case study link] The score is the headline. The drop in open issues is the mechanism.
Solutions page: 5S / 6S
6. Work instructions and standard work
Delivering the current revision of a procedure to the person performing it, with the confidence that it is the current revision.
Paper work instructions have a version control problem that nobody notices until an audit. The binder at the line holds revision 4. Revision 6 was issued in March. Nobody can say with certainty which one was followed in April.
The connected worker version also captures what was found while following the instruction, which is the part standalone work instruction tools tend to leave out.
Related reading: the 10 best work instruction software for manufacturing
7. Skills matrices and training verification
Proving the person performing a task was qualified to perform it, on the version of the procedure in force at the time.
This is the pairing an auditor increasingly asks for: not just the completed check, but evidence that whoever completed it was trained on the current revision. A training certificate from fourteen months ago does not evidence that.
Ajinomoto Toluca uses Weever Documents for skills matrix training. [attach case study link]
Solutions page: Skill Development
8. Shift handover and production logs
The handover is where more operational knowledge is lost than anywhere else in the plant.
A verbal handover transfers what the outgoing operator remembers to what the incoming operator retains, and nothing survives to the following week. A handover note in a book is slightly better and equally unsearchable.
This matters more than it looks. 62% of leaders in Weever's 2026 State of Data Capture in Manufacturing research, a survey of 167 manufacturing leaders at companies with more than 500 employees, said important operational knowledge frequently or very frequently stays only in the experience of operators and inspectors. The handover is the moment that knowledge either gets recorded or evaporates.
9. Lockout tagout execution and verification
Worth being precise about the boundary here, because this is a crowded space with a clear dividing line.
Procedure authoring, the writing and maintenance of machine-specific lockout procedures, is served by dedicated tools like Brady LINK360 and Master Lock cLOTO. A connected worker platform is not competing for that job.
Execution and verification is a different layer. Did the isolation actually get performed, by whom, in what sequence, with photo evidence at each energy source, and was the group lockout verified before restart. That is a frontline task with evidence requirements, and it belongs on the same platform as your other frontline tasks.
Most plants have the procedures documented and cannot prove the executions.
10. Internal and customer audit preparation
Less a program than an outcome of the other nine, but worth naming separately because it is frequently what unlocks the budget.
The audit prep cost of a paper plant is not the audit week. It is the week before, spent pulling records, discovering that two months of one log are missing, and reconstructing what happened from memory and half-legible handwriting.
When the nine programs above are captured digitally, audit prep becomes a filter and an export.
Which program should you digitize first?
Not the easiest one. The one with the most paper and the highest consequence, because that is where the return is largest and the internal case for expansion gets made.
The Weever research gives a useful starting point on where paper still dominates:
Weever, State of Data Capture in Manufacturing, 2026. n=166. Respondents could select multiple programs.
Two thirds of respondents run at least two frontline programs this way. Only 10% run none.
Quality and safety sit at the top, and they are also the two programs most likely to be audited and most likely to trigger a recall or a recordable. For most food and beverage plants that makes quality the obvious first candidate, with sanitation close behind on recall exposure even though fewer plants run it on paper.
Three questions to settle it for your plant:
- Which program would cost you most in an audit tomorrow? Start where the exposure is.
- Which one generates the most paper per shift? That is where the capacity recovery is.
- Which one has a supervisor who wants this? The first program needs an internal champion more than it needs a perfect business case.
If two of those three point at the same program, that is your answer.
What changes when programs share one platform
Running all of these in one system is not just a procurement convenience.
When quality, safety, sanitation, and autonomous maintenance each run in a different tool with a different set of fields, the same failure gets described four different ways depending on which program caught it. 51% of leaders in the Weever research said the same issue is frequently recorded differently depending on who logs it. Separate tools per program guarantee it.
One set of field conventions across programs is what lets you see that a sanitation miss on line 3, a quality hold two shifts later, and a maintenance abnormality the week before are one root cause rather than three unrelated records.
That cross-program view is the thing paper cannot produce at any level of diligence, and it is the reason plants that start with one program rarely stop there.
Start with one program, go slow, expand quickly
Pick the program with the most paper and the highest audit exposure, digitize the process you already run rather than an improved version of it, and expand once it is working.
Ultimately, you can start one of these programs at your facility this quarter. Monin rolled out across its entire North American operation in five months. [attach case study link]
Why manufacturers choose Weever
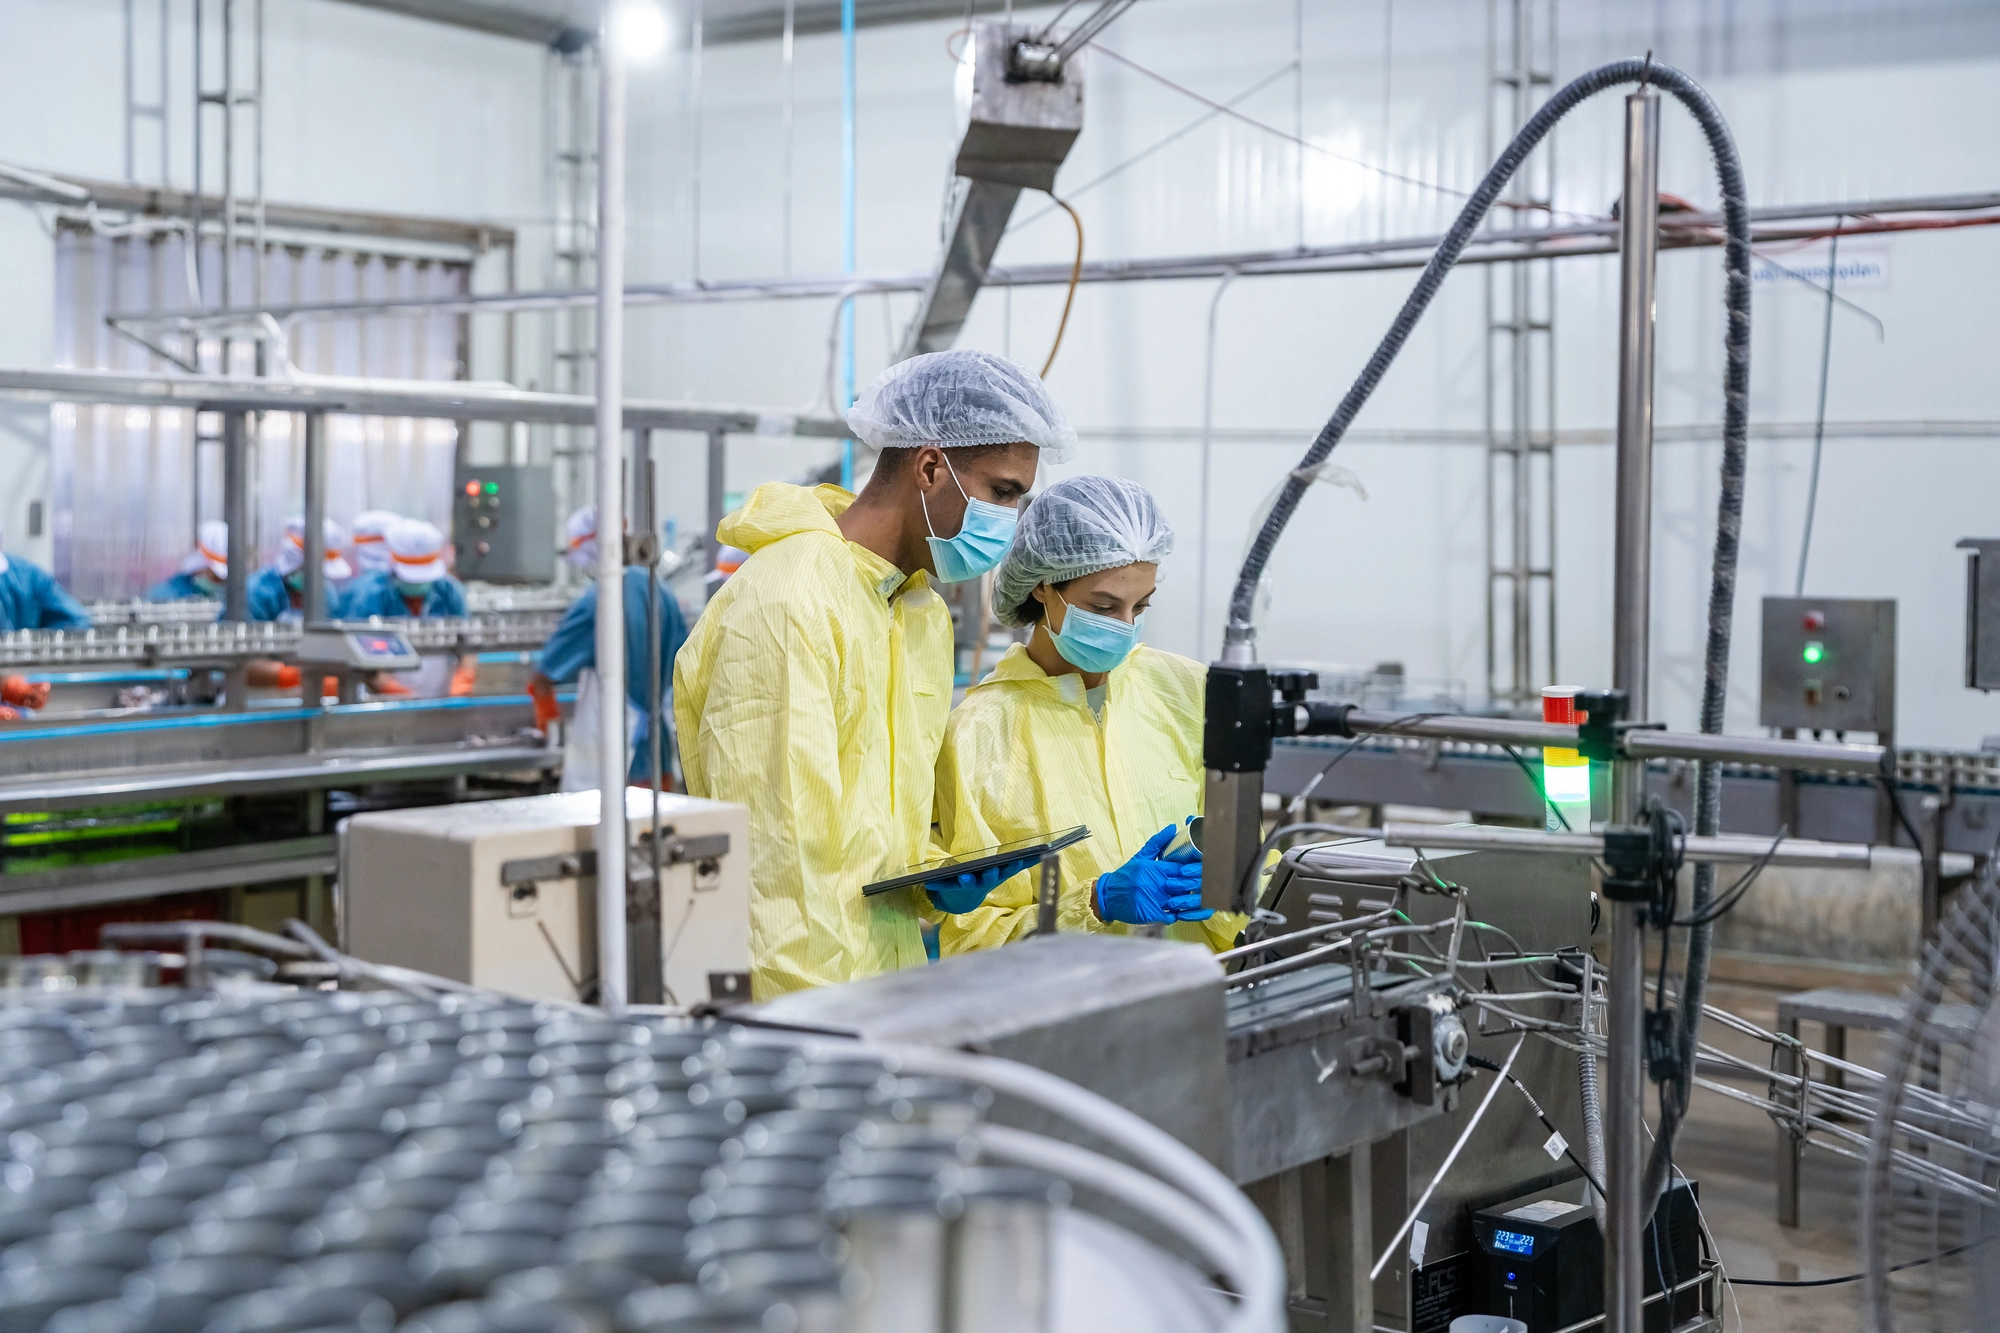
Ten programs, one configuration
Adding the second program is a configuration decision, not a contract negotiation, and it shares the field conventions of the first.
Site-based pricing, unlimited users
Every operator and sanitor can participate, which is what makes observation and near-miss programs actually work.
Built around your existing process
Your frequencies, your zones, your scoring criteria. Digitize what you run today, improve it later with data behind you.
Findings that close
Every failed step becomes an owned action with a due date, tracked to closure, across every program on the platform.
Want to talk through which program to start with? Book a demo.
Frequently Asked Questions
What are the main use cases for connected worker software?
Autonomous maintenance, master sanitation schedules, quality and in-process checks, safety observations and near misses, 5S and 6S audits, work instructions, shift handover, lockout tagout execution, skills matrices, and audit preparation. Any recurring frontline task currently on paper is a candidate.
Which program should a plant digitize first?
The one with the most paper and the highest audit exposure, not the easiest to configure. In food and beverage that is usually quality or sanitation. Weever research found 66% of quality programs and 63% of safety programs still run primarily on paper, spreadsheets, or homegrown tools.
Can one platform really run all these programs?
Yes, and there is a reason to insist on it. When each program runs in a separate tool with separate fields, the same failure is described differently depending on which program caught it, which makes cross-program patterns impossible to see.
Is connected worker software suitable for lockout tagout?
For execution and verification, yes: proving the isolation was performed, in sequence, with evidence at each energy source. Procedure authoring is a different job served by dedicated LOTO tools. Most plants have documented procedures and cannot evidence the executions.
How many programs do plants typically run on one platform?
Most start with one and expand. Adding programs is straightforward when pricing is site-based and the platform shares one configuration model. It is a contract negotiation when pricing is per module.
Does connected worker software replace our CMMS for maintenance?
No. A CMMS runs the maintenance department: work orders, spares, PM scheduling. Connected worker software runs operator-performed maintenance, and escalates into the CMMS when a finding needs a technician, a part, or a scheduled window.
How long does it take to add a second program?
Considerably less than the first, because the field conventions, the corrective action workflow, and the reporting are already configured. The main work is the form design session with the people who run that task.
.webp)
How to Implement Connected Worker Software Without Disrupting Production
The rollouts that fail are rarely the ones with the wrong software. They are the ones that tried to digitize five programs across four sites while simultaneously redesigning the processes, and stalled somewhere in month seven with a half-configured system and a floor that has gone back to paper.
This is the sequence that works instead, why each step is in the order it is, and what a realistic 90 days looks like.
How long does it take to roll out connected worker software?
One program on one line should go live in weeks. A full multi-program rollout across a site typically runs a few months, and multi-site is a sequence of site rollouts rather than one project.
What stretches a timeline is almost never the software. It is three things:
- Trying to improve the process while digitizing it
- Requiring IT development for configuration
- Waiting for a steering committee to agree on scope.
Why big-bang digital transformation projects stall
Three failure patterns, and most stalled rollouts have all three.
- Too much scope at once. Five programs means five sets of stakeholders, five configuration efforts, and five opportunities for one objection to block everything. Nothing goes live, so nothing proves value, so support erodes.
- Process redesign bundled in. Somebody sensibly observes that if you are digitizing the sanitation schedule you may as well fix the frequencies at the same time. Now you have a software project and a process change project, and the floor is being asked to learn two new things simultaneously. When it goes badly, nobody can tell which change caused it.
- No visible win in the first sixty days. Manufacturing organizations extend patience based on evidence. A project with nothing to show at the end of month two is a project that starts losing its champions.
The antidote to all three is the same: go narrow, go fast, and change nothing about the process on the first pass.
Step 1: Pick one program and one line
Selection criteria, in priority order:
- Highest paper volume. This is where the recovered hours are, and recovered hours are what fund the expansion.
- Highest audit exposure. This is where the risk reduction is, and risk reduction is what convinces the people who did not want to do this.
- A supervisor who wants it. The first program needs an internal champion more than it needs a perfect business case.
In most food and beverage plants that points at quality or sanitation. Weever's 2026 State of Data Capture in Manufacturing research, a survey of 167 manufacturing leaders at companies with more than 500 employees, found 66% of quality programs and 63% of safety programs still run primarily on paper, spreadsheets, or homegrown tools.
One line, not the whole plant. You want a group small enough that you can walk out and talk to every person using it in an afternoon.
Step 2: Digitize the process you already run
Not the better version. The current version, including the parts you know are imperfect.
This is the step people push back on hardest and the one that matters most. Use the same frequencies, the same zone structure, the same scoring criteria, the same inspection sequence, and the same routing logic you use today.
Do this for 2 reasons:
- Adoption. The message to the floor becomes "the process you already follow now runs without the binder." That is a message people accept. "Here is a new system and also a new process" is two changes, and the second one gives everybody a reason to blame the first.
- Attribution. If you change the process and the software at once and the numbers move, you cannot say which did it. Digitize first, get a clean baseline, then improve with data behind you.
We have written about this at more length in why you should not have to change your manufacturing processes to go digital.
One exception worth making: form length. If your current paper form has sixty fields, do not faithfully reproduce sixty fields. A sixty-field form is not more rigorous than a twelve-field form, it is a twelve-field form with forty-eight fields filled in from memory.
Run each field through four questions:
- does anyone act on this
- does it always move with another reading
- could it be weekly instead of every shift
- does it require a tool or a ladder to reach.
This blog post talks about the ECRS method for Autonomous Maintenance: Eliminate, combine, reduce, simplify.
Step 3: Build the forms with the people who fill them out
Not for them. With them, in the room, at the line.
This is treated as a courtesy and it is actually the highest-leverage adoption mechanism available. An operator who helped decide what the form asks will defend it to the next shift. An operator handed a form built in an office will find the fastest route through it.
What to do specifically: sit with two or three people who run the task, walk the current paper version step by step, and ask at each step what they actually do, which is frequently not what the form says. The gap between the documented process and the real process is where most of your form design decisions live.
Watch for the fields nobody uses, the step everyone does in a different order, and the thing they always check that is not on the form at all. That last one is usually the most valuable field you will add.
Step 4: Run parallel and prove the data matches
Run digital and paper together for two to four weeks. Not longer, because parallel running is double work and people stop doing one of them.
What you are checking:
- Completion rates match. If digital completion is lower, the digital version is slower or harder, and that is a configuration problem to fix before you cut paper.
- Findings volume is at least as high. If people are reporting fewer issues digitally, something in the flow is discouraging reporting.
- Nothing is systematically missing. Look for the step that gets skipped, the shift with lower completion, the field left blank every time.
Then cut paper on a date, announce the date, and hold it. A parallel period with no end date becomes permanent, and you end up maintaining two systems indefinitely.
Step 5: Expand line by line, then program by program
Second line first, then third, then the rest of the plant on that one program. Only then the second program.
The reason for that order: expanding the same program to a new line is a copy exercise, and it gets faster each time. Adding a new program is a fresh configuration effort with fresh stakeholders. Do the easy multiplication before you take on the new problem.
By the third line, someone from line one should be running the rollout conversation rather than you. That handoff is the signal that the program will survive without executive attention.
One thing to carry forward deliberately: use the same field conventions on the second program that you used on the first. This feels like bureaucracy and it is what makes cross-program analysis possible later. 51% of leaders in the Weever research said the same issue gets recorded differently depending on who logs it. Separate conventions per program guarantee that outcome.
What role does IT actually need to play?
Three things, and nothing else:
- Single sign-on. A day or two of work, and it materially affects adoption, because another password is another reason not to complete the check.
- Device policy. What hardware, who owns it, how it is mounted and charged, and what the ingress rating needs to be in washdown areas.
- Integrations, if you are connecting to the CMMS or a BI tool at go-live. Many plants defer this to phase two, which is a reasonable choice.
What a realistic 60-day rollout looks like
Note what is not in this table: a training programme. If the tool needs classroom training for an operator to complete a check, it is the wrong tool. A floor briefing and a tag at the machine should be enough.
What to watch in the first ninety days
Four signals, checked weekly.
- Participation by shift. A plant-wide average hides the shift that has not adopted. Break it out from day one.
- Issues volume. This should go up. Tell leadership that before go-live, because a rise in reported issues looks like a problem and is actually the system working.
- Time from submission to owner. Should be immediate. If actions are sitting unassigned, the configuration is wrong.
- Closure rate. The number that predicts whether this survives. Mars Fort Smith reached 100% task completion within a month of go-live and an 89% corrective action closure rate. Adient went from more than 60 open issues a month to fewer than 5.
If issues volume rises and closure rate holds, the program is working. If issues volume falls in month three, people have stopped reporting, and no dashboard will tell you that directly.
Start narrow
One program, one line, the process you already run, built with the people who run it, proven in parallel, then multiplied.
Weever implements alongside you rather than handing you a login. Configuration to your existing process, not a template you have to adopt, and a plant admin who can change a form without a support ticket afterward.
Want to map this against your own plant? Book a demo, or read more about how onboarding and implementation works.
Frequently Asked Questions
How long does connected worker software take to implement?
One program on one line typically goes live in weeks. A full site rollout across multiple programs runs a few months. Timelines stretch most when plants redesign processes while digitizing them, or when configuration requires IT development rather than a plant admin.
Should we improve our process before digitizing it?
No. Digitize the process you already run, get a clean baseline, then improve with data behind you. Changing both at once means the floor faces two changes simultaneously, and if results move you cannot tell which change caused it.
How much IT involvement is required?
Single sign-on, device policy, and integrations if you are connecting systems at go-live. Usually a handful of days. If a vendor needs sustained IT development to configure a checklist, your forms will drift out of date because nobody raises a ticket to change a form.
How long should we run paper and digital in parallel?
Two to four weeks. Long enough to confirm completion rates and findings volume match, short enough that people do not abandon one of the two. Set the paper cut-off date in advance and hold it, or the parallel period becomes permanent.
Which program should we roll out first?
The one with the most paper, the highest audit exposure, and a supervisor who wants it. In food and beverage that is usually quality or sanitation. Start on one line, not the whole plant.
Do operators need training?
A floor briefing should be enough. If completing a check requires classroom training, the tool is too complex for the job. New hires should be able to complete their first task by scanning a tag, without a supervisor beside them.
What if reported issues go up after go-live?
That is the expected outcome and a sign the system is working. People are reporting things that previously went unrecorded. Brief leadership on this before go-live so a rise in findings is not read as a deterioration in performance.
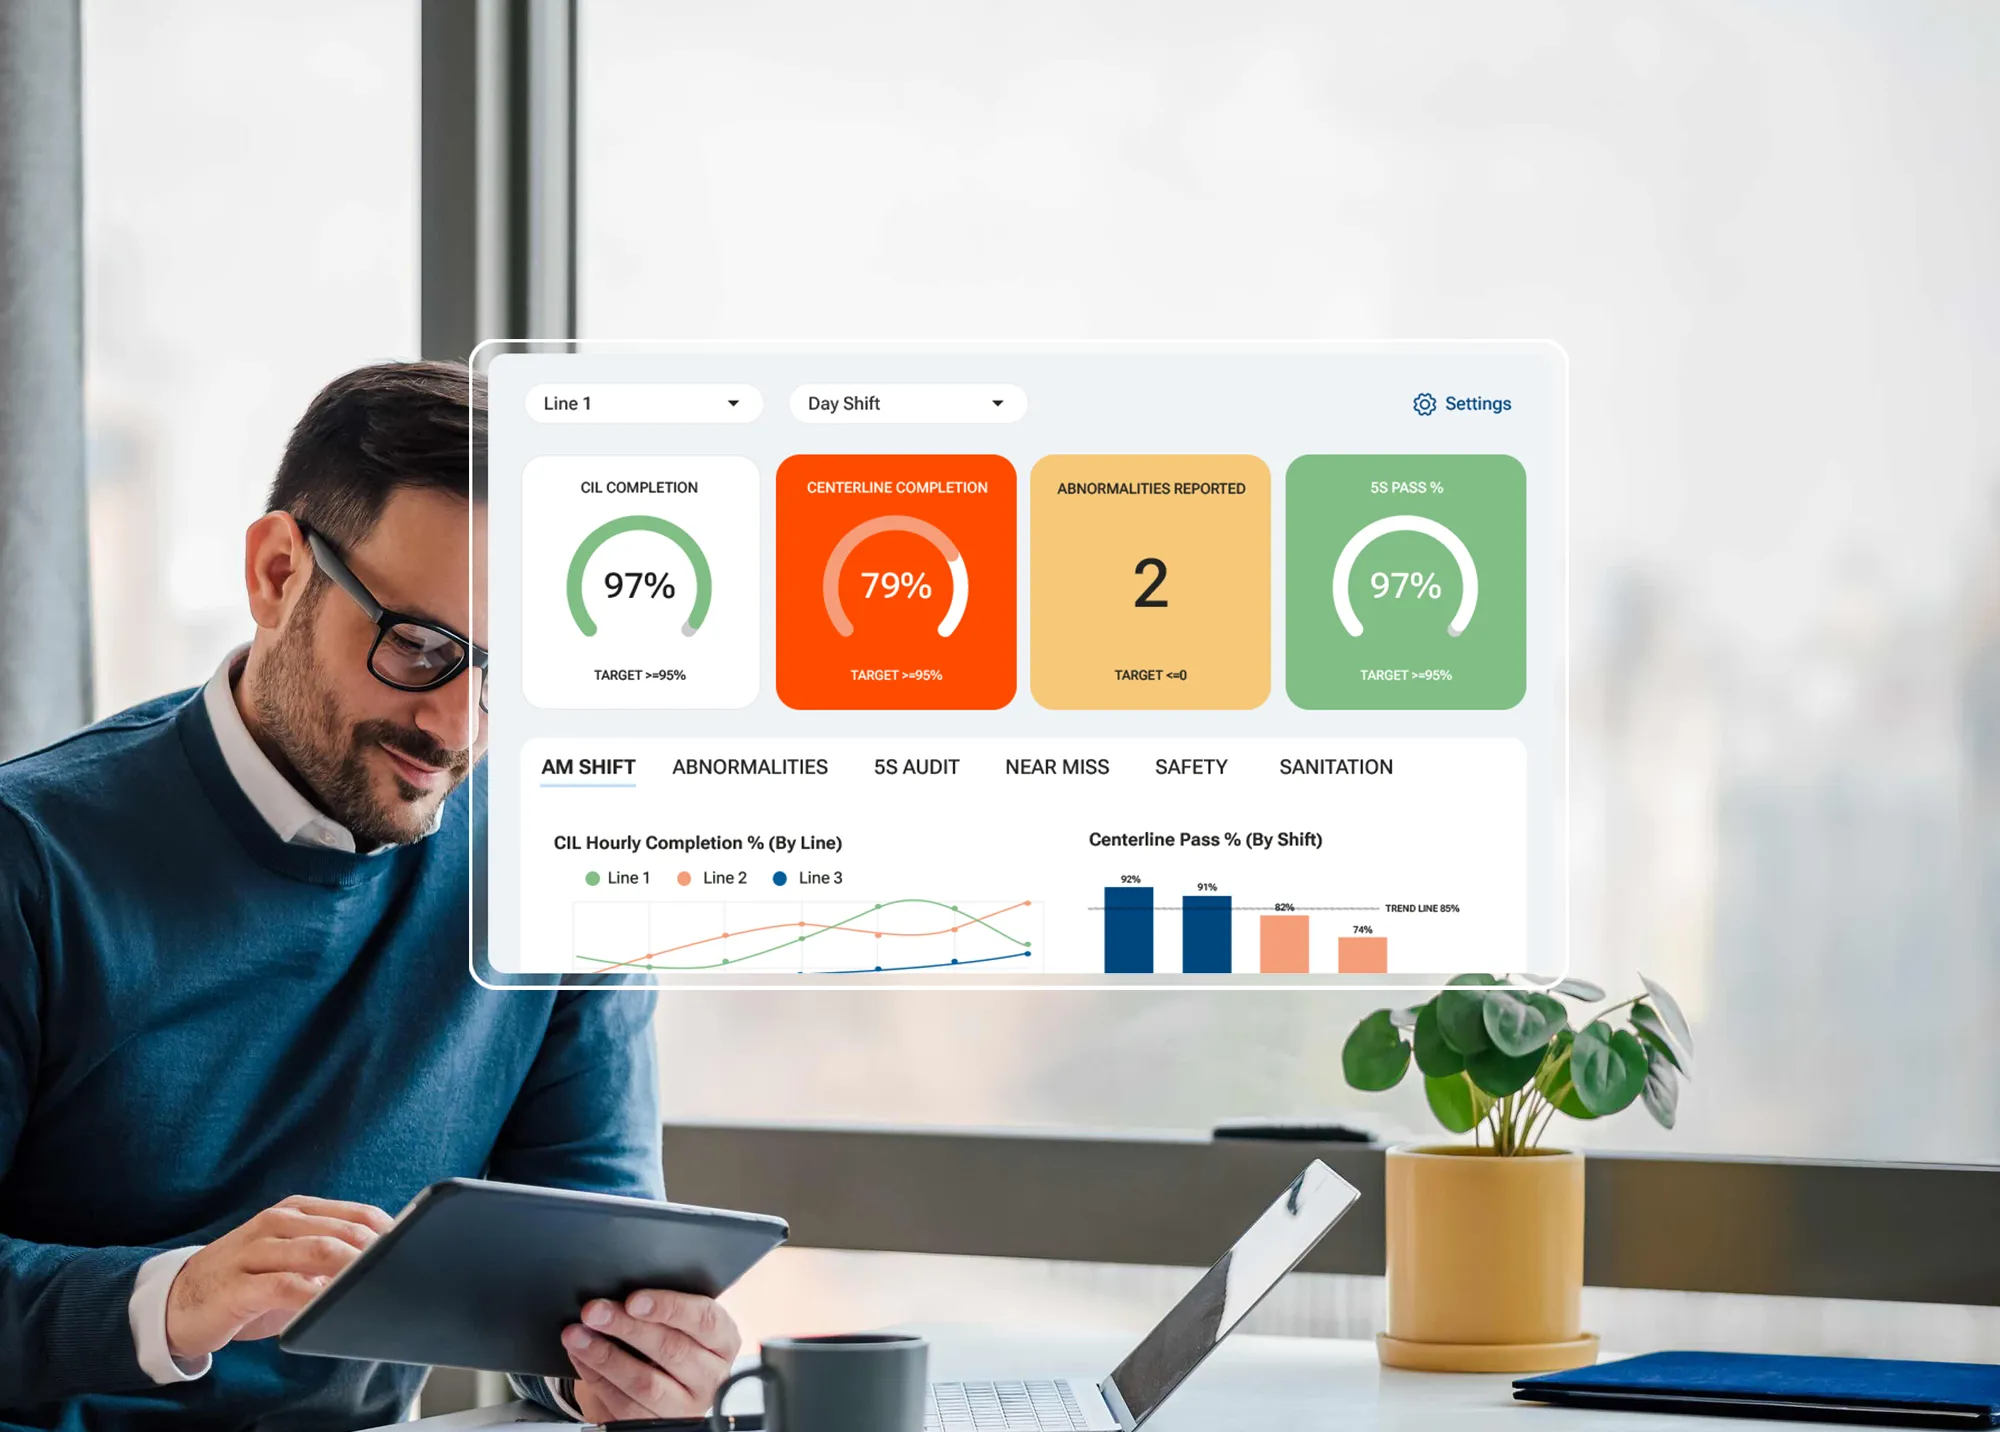
7 Factors to Evaluate Connected Worker Software
Choosing connected worker software takes more than scrolling through feature lists. Every platform in this category will show you a clean mobile form and a dashboard, and none of that tells you whether your night shift will still be using it in month six.
This guide covers the seven factors that separate platforms once they are on the floor, a weighted scorecard you can copy, and 15 questions worth asking on a demo.
Key takeaways
- Floor adoption determines return more than any single feature, because a platform operators avoid produces no data to act on.
- The clearest line between a platform and a forms app is what happens after someone hits submit. A failed step should create an owned corrective action automatically.
- Audit-ready records are attributable, system-timestamped, evidenced at the step, versioned, and retrievable. Ask to see all five.
- Per-seat licensing puts a price on participation, in a program whose value depends on participation.
- Test on your own floor, on your own network, and in your own cold room before you sign anything.
What should you evaluate before buying connected worker software?
Seven things, roughly in the order they determine success or failure:
- Whether the floor will actually use it
- Whether findings get tracked to closure
- Whether the records hold up in an audit
- Whether the pricing model lets everyone participate
- Whether it runs more than one program
- Whether it fits the systems you already run
- How fast it goes live and what support looks like afterward
Only two of those are feature questions, and the ordering comes from what goes wrong in practice. In Weever's 2026 State of Data Capture in Manufacturing research, 167 manufacturing leaders at companies with more than 500 employees were asked to name the single biggest factor hurting frontline data quality. Manual and paper-based processes came first at 36%, ahead of disconnected systems at 26% and lack of standardized processes at 19%. Inconsistent software adoption came last among operational causes at 10%.
Our reading of those results: most plants lose frontline data because the capture never happens, or never leaves paper. Picking the wrong features is a smaller cause.
1. Factory floor adoption and usability
Operators route around software that slows them down, and once they do, the platform's capabilities stop mattering.
Test it under real conditions, not in a conference room. Can a new hire complete their first task without a supervisor standing next to them? Does it work with gloves on? Can someone reach the right form by scanning a tag at the machine, or do they have to navigate a menu and log in first? These are the day-to-day realities for frontline operators, and they decide whether a rollout sticks.
The benchmark is that the digital version has to be faster than the clipboard. If it takes longer, the clipboard wins, usually quietly over about eight weeks rather than in a confrontation.
Ask about form length too. A sixty-field form tends to become a twelve-field form in practice, with the other forty-eight filled in from memory at the end of the shift.
2. Corrective action tracking and closure
This factor separates a platform from a forms app, and buyers skip past it more often than any other.
Capturing data is half the job. What matters is what happens when a check reveals a problem. A failed step should create an action automatically, with an owner, a due date, and an escalation path, before the operator has walked to the next station. Nobody should have to read a submission, decide it matters, and assign it by hand.
Make corrective action closure rate your primary metric. Completion rate only tells you the check happened. Closure rate tells you whether anything the check found got fixed.
Mars Fort Smith reached 100% task completion within a month of go-live and an 89% corrective action closure rate. Royal Canin runs a 95% close rate.
There is a second reason closure matters, and it has more to do with people than paperwork. Operators decide whether to keep reporting based on what happens after they report. When they see problems get fixed, reporting becomes routine. When nothing happens, reporting tends to stop within a quarter, and the drop shows up in your data looking like improvement.
3. Compliance and audit readiness
Food manufacturing faces scrutiny from FSMA, HACCP, GFSI schemes, and customer audits. Whether the record in question is a sanitation task or a quality check, the underlying question is the same: can you prove this procedure was followed on this date by this person?
Five attributes make a record audit-ready. Ask to see each one:
If you operate under 21 CFR Part 11, ask the vendor exactly what they mean by "Part 11 ready." Vendors use the phrase to cover a wide range of actual capability.
4. Site-based pricing with unlimited users
Per-seat licensing creates a problem that does not show up until the program starts working.
When each additional user costs money, plants limit who gets an account. The limit usually lands on the people furthest from the office, who are also the people doing the observing. The result is a connected worker program in which most of the workers are not connected.
Per-seat pricing also penalizes success. A rollout that goes well brings more people in, so the invoice grows at exactly the point you are trying to expand.
Site-based pricing with unlimited users removes that decision. Everyone can report, so problems surface earlier and more of them get found.
Whatever model you evaluate, price out five programs across all your sites, not just the pilot. The two numbers diverge sharply. For the return side of the comparison, ROI calculators for sanitation, autonomous maintenance, and 5S audits can help you frame the business case.
5. Support for multiple programs on one platform
Plants run overlapping frontline programs: sanitation, autonomous maintenance, quality checks, safety observations, 5S audits, and work instructions. Running each in a separate tool creates silos and duplicate administration for the same supervisors.
It also breaks something less obvious. When each program has its own tool with its own fields, the same failure gets described four different ways depending on which program caught it. An issue logged on a quality check cannot be compared with the same issue logged on a safety observation, because the two were never recorded as the same thing.
In the Weever research, 51% of leaders said the same issue is frequently or very frequently recorded differently depending on who logs it. Separate tools for each program make that worse by design.
Ask whether additional programs require new modules, new contracts, or new fees, and whether they share one set of field conventions and one corrective action workflow.
6. Integration with existing systems
Your plant already runs an ERP, probably a CMMS, and some form of BI. A connected worker platform should fit into that stack rather than replace it.
For most plants, the CMMS integration matters most. When an operator finds an abnormality that needs a technician, a part, and a scheduled window, it should escalate into the maintenance system as a work order with the photo and context attached. A supervisor should not have to retype it.
BI comes next. Frontline completion and closure data should land in the reports leadership already reads, without someone rebuilding a deck by hand every Monday.
AI raises the stakes. In the same Weever research, 81% of leaders agreed that disconnected systems limit the effectiveness of AI across their operations.
Ask for specifics: which systems, through what mechanism, and whether you can see a live example.
7. Implementation speed and ongoing support
Ask two questions: how long it takes to go live on one program on one line, and how much of your IT team's time that requires.
Good answers are measured in weeks and in single-digit IT days. IT involvement should be limited to single sign-on, device policy, and integrations. If a vendor needs sustained IT development to configure a checklist, that checklist will drift out of date within a year, because nobody will raise a ticket to change a form.
Ask who does the configuration work during rollout, and who does it in year two when your process changes. A plant admin should be able to edit a form without contacting support. As a reference point, here is how Weever handles onboarding and implementation.
Monin rolled out across its North American operation in five months.
Connected worker software evaluation scorecard
Copy this into a spreadsheet and score each vendor from 1 to 5. The weightings reflect what predicts success on the floor, which is often different from what is easiest to demo.
One caution on scoring. Adoption and closure carry 45% between them because they determine whether anything else matters, and they are also the two hardest to assess from a demo. Weight your evidence accordingly: insist on a floor trial for adoption, and a live walkthrough of a failed check for closure.
15 questions to ask on a connected worker software demo
Question 5 is the most diagnostic on the list. With a forms app, you will see a submission land in a table. A platform should show you an owned action with a due date and an escalation path.
Choosing software your floor will actually use
The right platform fits the process you already run instead of forcing your teams to redesign how they work. It gives you records that hold up in an audit, it drives findings to closure instead of just documenting them, and it does not charge more for the participation that makes it work.
Weever is built for food, beverage, and CPG manufacturers running sanitation, autonomous maintenance, quality checks, safety, and 5S. It offers site-based pricing with unlimited users, is configured to your process, and goes live in weeks.
Want to run this scorecard against your own requirements? Book a demo.
Frequently Asked Questions
What should you look for in connected worker software?
Floor adoption, corrective action closure, audit-ready records, a pricing model that does not limit participation, multi-program support, integration with your CMMS and BI tools, and fast implementation with minimal IT involvement. Adoption and closure matter most because they determine whether anything else has value.
How is site-based pricing different from per-seat licensing?
Site-based pricing charges one fee per facility, however many people use it. Per-seat pricing charges for each user, which limits who gets access and makes costs grow as the program succeeds. In a category whose value depends on participation, that is a structural constraint as well as a line item.
What compliance standards should a connected worker platform support?
For food manufacturing, expect FSMA, HACCP, GMP, and the relevant GFSI scheme, plus 21 CFR Part 11 for electronic records where applicable. Look for audit trails, version control, signature attribution, system-generated timestamps, and fast retrieval.
How long does implementation take?
One program on one line should go live in weeks. Full multi-program, multi-site rollouts take longer and should be sequenced rather than launched all at once. Timelines stretch most when a plant tries to redesign its processes while digitizing them.
What metric should I track to know if it is working?
Corrective action closure rate, and time to closure. Completion rate only proves the check happened. Also watch reported issue volume, which should rise after go-live. A rise means people trust the system enough to report.
Can connected worker platforms integrate with ERP and CMMS?
Most can, through APIs, scheduled exports, or direct connections. For most plants, the highest-value integration escalates an operator-reported abnormality into the CMMS as a work order with the photo and context attached, so nobody has to retype it.
Should I run a pilot before committing?
Yes. Run one program on one line, on your own floor, in real conditions, including cold rooms, washdown areas, and the spots where network coverage is weakest. A conference room demo tells you nothing about how the platform performs on your network, whether it works with gloves, or whether the digital version is faster than the clipboard.
Data Privacy Statement
1. Purpose
The Data Privacy Statement (DPS), as required by European Union General Data Protection Regulation (GDPR), relates to data that identifies a person (in the EU). This Data Privacy Statement also serves as a reference document for US legislation 21 CFR Part 11; Electronic Records and Signatures and European Union (EU) Annex 11; Computerized Systems. Weever Apps Inc. achieved attestation of compliance to 21 CFR Part 11 and EU Annex 11 on September 12, 2019. A copy of the attestation letter from Computer System Validation is available on request.
Also see our web site privacy policy and company security page.
2. Referenced Policies
- 10007: Information Security
- 10008: Internal Audits for Weever Process
- 10010: Information Classification and Handling
- 10011: Risk Assessment Management Policy
- 10013: Data Backup
3. Policy
3.1 Company information
Weever Apps Inc.
120 Hughson St. S
Hamilton, Ontario L8N 2B2
3.2 Business description
Weever Apps Inc. is an enterprise software company that provides cloud-based solutions for customers in manufacturing and related services. Our focus is on process execution and digital form management.
3.3 What data does Weever Apps collect, for which people, and how is it used?
Weever Apps uses digital forms to collect process execution data in the course of manufacturing execution. Data collected is used to visualize active processes and provide both flat and aggregate reports on process/quality execution. Standard activity data collected for a given process may include recurring entry of product property measurements (e.g., product weight or composition) by line operators, task completion by line operators, safety checks, and both quality task completion and measurement activities by quality (QA) and other staff.
Weever Apps provides a form "builder" (tool) that allows our customers to collect any data they wish. Any data collected should comply with all rights and agreements in their locale. Weever Apps is not responsible for any forms built by our customers or any data collected using those forms or tools.
Personal data (PII) collection is limited to user accounts and manufacturing execution activity by customer staff (generally production line operators and quality assurance staff.
Data collected for a given person (user account) is limited to:
- Name (first, last)
- Email address
- Job role(s) (e.g., Operator, Quality)
- Work telephone number
Your user account information is never used for marketing, sales or other commercial purposes.
We may also collect information about the device you're using, including what type of device it is, what operating system you're using, device settings, unique device identifiers, crash reports and other technical data.
Whether we collect some or all of this information often depends on what type of device you're using and its settings. For example, different types of information are available depending on whether you're using a Mac or a PC, or an iPhone or an Android phone. To learn more about what information your device makes available to us, please also check the policies of your device manufacturer or software provider.
3.4 Which country(s) do these people represent?
Most customer data is limited to North America (US, Canada) and Europe.
3.5 What types of data do you collect and store?
Our products collects written data through digital forms. Software features allow for the user upload of digital photos, scanned paper documents (PDF's) and other various document and file types. Entered and uploaded data is stored in a secure database and content delivery network (CDN).
3.6 Management of collected data
Access to data stored by Weever Apps Inc. and management thereof is limited to:
- Weever Apps Inc. software users with valid, authenticated sessions and appropriate user access roles
- Authorized Weever Apps database and infrastructure administrators
- Authorized Weever Apps staff (e.g., developers)
- Authorized Weever Apps contractors for limited engagements
Weever Apps Inc.'s "Process" product does not support any "hard delete" functions, deletion of assets in the CDN, or any actions that may disrupt the "audit trail" as described in 21 CFR Part 11; Electronic Records and Signatures (security, audit trails, electronic signatures).
Contractor access:
As a rule, Weever Apps Inc. does not provide access to any production client-specific content or client-specific application data to third-party contractors, with the exception of:
- DevOps or security review support where such access may be unavoidable through reasonable means
- Contracting for the creation of Power BI data reports, of fixed scope and limited read only access
- Contracting for the creation, modification or conversion of client forms within Weever, predominantly for new app set up and explicitly limited in scope of access and authorization to those operational tasks
- Anonymous user statistics and logs, as provided for analysis purposes
Contractors are subject and must agree to the same policies, recurring checks, constraints and policy enforcement activities as Weever Apps Inc. employees with the single exception that contractors are not required to enroll in Weever Apps Inc. security awareness training.
3.7 Physical location of data
All server instances including databases are located in the United States (Northern Virginia).
3.8 How is the data stored?
Textual data is stored in a secure PostgreSQL database. Asset data (e.g., images, PDF's) are stored in a secure CDN repository managed by Weever Apps Inc.
3.9 Are you certified under the EU-U.S. Data Privacy Framework (DPF)?
As a Canadian company, Weever Apps Inc. is not eligible for certification under the DPF.
However, our U.S. based web hosting and data storage provider Amazon Web Services (AWS) is a supporter of, and fully certified to, EU-U.S. Data Privacy Framework (DPF) standards. For more information please see: https://aws.amazon.com/compliance/eu-us-data-privacy-framework/
3.10 Is Weever Apps a Data Controller (owns the data) or Data Processor (processes on behalf of the Data Controller)?
Weever Apps Inc. is a Data Controller. No third-party or otherwise contracted companies process customer data directly on our behalf.
3.11 Who has access to product data within and external to your company?
Weever Apps staff may have limited access to production data by using an administrator-level user login to the client's given application and server instance.
21 CFR Part 11 Compliant Products, "FDA Compliance" rules:
Standard authentication, access and authorization policies apply, there is no "god" user role and functions are limited by FDA-compliant user access (role) definitions.
All Products:
Specialized DevOps (IT) administrators may access or copy a production data, or a backup thereof, to ensure compliance with procedures within SOP 10013 Data Backup.
Contractors may be given limited access to complete specific tasks:
- DevOps or security review support where such access may be unavoidable through reasonable means
- Contracting for the creation of Power BI data reports, of fixed scope and limited read only access
- Contracting for the creation, modification or conversion of client forms within Weever, predominantly for new app set up and explicitly limited in scope of access and authorization to those operational tasks
Unless stated explicitly herein, no other vendors, persons or services external to Weever Apps may access customer data.
3.12 How is access to the data limited to your workforce?
All data is encrypted in transit. All data is protected by redundant layers of authentication and authorization protocols including:
User access practices common to all products:
- Access limited to authorized individuals using roles, privileges are assigned to role not individuals
- Active access management, escalation proposal and authorization by review-first
- Password composition requirements (min 8 characters, alphanumeric)
- Passwords are not displayed when entered
- Password encryption, upon entry, in storage
- Unique User ID's
- Logging of all user access activity
- Recurring review of plugins, packages and technical artifacts for security/functional risks
- (SOP 10011 Risk Assessment Management Policy for Weever Process)
User access practices specific to Weever Apps Inc. Process product:
- Application: Secure login/user system in compliance with 21 CFR Part 11
- No users with “God” role, no IT people with “God” role, system administrator role is limited
- Password change frequency (90 days)
- Password reuse frequency (1 year)
- Automatic log out of inactivity in application (1 hour)
- Auto lockout after too many failed login attempts (5) and notification to system security staff
- User access activity reports, full, dedicated report limited to one user role
- Last login displayed when logging in
- IP difference warning alerts (automatic, no refresh is required)
- Please note: Some user management policies listed here are customer configurable at your own risk
Server and service management
- Layers of authorization and authentication policies, infrastructure-data access requires multiple authenticated logins and verifications checks across 3+ layers
- No internet-available transfer of data (no internet-facing access to data sans application)
- Secondary, unique application to server credentials and authorization, secured with TLS
- Network isolation and systems firewall for distributed components
- Recurring review of plugins, packages and technical artifacts for security/functional risks
- Antivirus and service/data monitoring for unusual traffic, spikes, other 'indicator' events
- Recurring checks for data/incident breaches and "pwned" checks for emails et al.
Company policies and procedures
- Dedicated roles for IT infrastructure provision and access approval
- Recurring reviews of staff access, remove inactive users, and verify access policies (monthly) Recurring internal audits of policy implementation including security (SOP 10008: Internal Audits for Weever Process)
- Recurring internal audits of policy and procedure compliance (SOP 10008: Internal Audits for Weever Process)
- Recurring internal reviews and sign off on all procedures (SOP 10001: SOP Management and Document Identification for Weever Process)
- Training and recurring information security policy compliance and review (SOP 10007: Information Security, SOP 10010: Information Classification and Handling)
- Rapid response team reviews and procedures (e.g., in event of data breach)
- Many additional secondary processes including vendor reviews, access reviews, inactive account reviews and more
Additional other policies are recurring events are also in place to protect your data.
3.13 What does Weever Apps do with my personal data?
Your user account details are used for the purposes of user management and to produce activity histories for manufacturing process execution. Basic access activities like login, or profile updates may also be recorded in a User Access Activity Report for the purpose of security and IT management
Your personal information is limited to the users described.
Weever Apps does not use your information for marketing or any other purpose.
3.14 What is your policy on sharing data with other parties?
As a principle we do not share your data with any third parties including contractors and service/applications.
In the event a valid exception is required, individual contractor staff may be granted time-limited access on a per project basis.
3.15 Who do you share data with?
As a principle we do not share your data with any third party services unless absolutely necessary.
- Server operations contractors or services may effectively have access to some your data per normal infrastructure operations
- Data visualization contractors may have limited access to your data in order to complete specific, project-based reports
- Contractor staff must accept and comply with all Weever Apps Inc. security policies in full before any consideration of access
- Access is granted on a strict need-to-know basis following our Data classification and System Access Control policies
- All contractor staff access is subject to, and included in, normal recurring risk management activities including system access reviews, inactive account reviews, access escalation/de-escalation reviews, policy compliance checks and more
Analytics services:
- Technical data may be on browser and device usage may be shared with third-party analytics services
- A very restricted set of non-sensitive personally identifiable information (PII) may be shared with third party services (e.g., name, email) solely for the explicit objective of rendering services and facilitating data storage on behalf of our clientele. For example, we may share a user's email address for the purpose of tracking onboarding tour completion in a third party service. All services and vendors are monitored for GDPR and privacy compliance.
Other types of sharing:
- It is imperative to underline that Weever Apps Inc. categorically refrains from engaging in the sale of any PII or customer data under any circumstances.
Sensitive personally identifiable information (PII)
- Per our Terms of Service (TOS), Weever Apps Inc. unequivocally disallows the utilization of its platform for any endeavour encompassing the acquisition and retention of PII data from individuals who are not employees or contractors of our clientele.
- In other words, our platform is explicitly proscribed for the collection PII data that may fall under the purview of legislation such as HIPAA or PIPEDA. This stance underscores our commitment to ensuring strict compliance with applicable data protection regulations and safeguards.
3.16 Do you share personally identifiable information? (PII)
Weever Apps Inc. will never request, share or sell sensitive personal information in any circumstance.
Non-sensitive PII:
- A very restricted set of non-sensitive personally identifiable information (PII) may be shared with third party services (e.g., name, email) solely for the explicit objective of rendering services and facilitating data storage on behalf of our clientele.
- For example, we may share a user's email address for the purpose of tracking onboarding tour completion in a third party service.
Other restrictions (HIPAA, PIPEDA, et. al.)
- Per our Terms of Service (TOS), Weever Apps Inc. unequivocally disallows the utilization of its platform for any endeavour encompassing the acquisition and retention of PII data from individuals who are not employees or contractors of our clientele.
- In other words, our platform is explicitly proscribed for the collection PII data that may fall under the purview of legislation such as HIPAA or PIPEDA. This stance underscores our commitment to ensuring strict compliance with applicable data protection regulations and safeguards.
3.17 How do you notify people that you have shared their data?
We do not share your site's non-technical data with any third parties unless there is an agreement to do so (e.g., for the purpose of a data visualization project between Weever and you, the customer).
3.18 How can I revoke consent for the use of my data? (Consent)
Weever Process product:
- Individual user account data and prior activities form part of the "audit trail" required for compliance to 21 CFR Part 11 and other best practices regarding software audit-ability. As such, individual user accounts are never deleted nor made invisible from administrative view.
- Staff who hold Weever Process accounts should contact a dedicated application administrator in their company to request an inactivation (to disabled status) of their user account.
- Additionally, after a configured period, any inactive account is disabled automatically.
- for site or customer-wide removal of data, please contact our data privacy contact.
Other products:
- Staff who hold user accounts should contact a dedicated application administrator in their company to request an inactivation (to disabled and not-visible status) of their user account.
- For site-wide removal of data, please contact our customer success team or the data privacy contact listed below.
3.19 Will you notify my company if a current or former staff person or contract makes a data request or removal request under the GDPR or related frameworks?
Yes, we will notify you within 30 days by policy and SOP.
3.20 Are you compliant under Article 46 of the GDPR (data transfers)?
Yes. Our standard contract includes clauses that cover situations when personal data is transferred from the EEA to a country without an adequacy decision (e.g., the United States). Per Schrems II, we include additional safeguards including encryption, a data privacy agreement, et al. Weever conducts internal privacy impact assessments (PIA's) and can support additional PIA's as needed.
3.21 Do you capture or store any non-adult data?
No. No user accounts exist for a person under 16 years of age.
3.22 How may I request changes to my data or my profile?
Individual users with a valid, active account may change their personal information in the "My Profile" section of our applications:
- Name (first, last)
- Email address
- Job role(s) (e.g., Operator, Quality)
- Work telephone number
- Phone
21 CFR Part 11 (Weever Process)
- Due to audit trail compliance (see 3.16), these changes do not affect any prior historical records in the Weever Process product.
All Products
- Individual users with a disabled/inactive account should contact their companies dedicated application administrator any request any changes via "User Management".
3.23 How can I review the data associated to my profile?
Individual users with a valid, active account may change their personal information in the "My Profile" section of Weever Apps Inc.'s products.
Individual users with a disabled/inactive account should contact their companies dedicated application administrator any request any profile information via "User Management".
3.24 How do you notify people of this data privacy statement and how to you notify them of updates?
Weever Process:
- Process customers are provided with a copy of this data privacy statement as part of their initial customer onboarding and training package.
- Any major changes to this data privacy statement require Weever Apps to notify all Process customers via email, including the new document and a short summary of changes made. Process customers are defined here as a dedicated application administrator for a given customer workplace (factory, or physical company location).
Other products:
- Weever Apps Inc. publishes our Data Privacy Statement as a web site page (this page). This document is available for review on request after contacting our dedicated privacy contact, as listed on that page.
3.25 When do you delete my data because it is no longer needed?
Weever Process:
- Individual user account data and prior activities form part of the "audit trail" required for compliance to
- 21 CFR Part 11 and other best practices regarding software audit-ability. As such, individual user accounts are never deleted nor made invisible from administrative view in current, "live" instances of Process software deployment(s).
- Individual Process instances may be taken offline and "closed" due to changes in sales contracts with the relevant enterprise customer(s). In this instance, personal account data will be inaccessible to all parties through normal (application) channels.
- A data backup of the application instance(s) and their respective databases will be maintained in secure storage by Weever Apps Inc. for a period of minimum five years. In this context, access is limited to dedicated Weever Apps DevOps administrators and senior staff.
Other Weever products:
- Deletion of data varies by contract term. Please contact us to learn more.
Agreements between Weever Apps Inc. and customers (contracts) may specify and override this policy default on a per-contract basis.
3.26 How do you notify persons if there is a data breach/data stolen? (Breech Notification)
In the event of a data or network security breach, Weever Apps Emergency Response Team will first prevent further damage and then designate a response team member to contact customers and notify them of the:
- The breach incident
- The extent of data lost or possibly compromised, at detail
Notified customers include but are not limited to a dedicated application administrator for each workplace (factory, or major physical location) using Weever Apps software. The dedicated application administrators are then responsible to further inform and notify any user account holders of the incident and the details / potential exposure of their personal data.
3.27 Do you use AI for automated decision making for any processes that significantly affect individuals?
No. Weever does not use AI-based automated decision making for any processes that significantly affect indvidual persons.
3.28 Do you conduct privacy impact assessments?
Yes, all major change planning requires a privacy impact assessment (PIA) to be completed by our security team.
3.29 How do you document the annual security review of this Data Privacy statement?
Weever Apps' QA Management conducts an annual review of this Data Privacy statement as part of our annual internal audit for all standard operating procedures (SOP's) and general compliance with company, client and government policies.
3.30 What do you do to protect your data?
All data is encrypted in transit.
All data is protected by redundant layers of authentication and authorization protocols including. Please see section 3.11 to review how our application design, server and service management, and company policies and procedures are organized to protect your data.
3.31 How do I contact Weever Apps with a data privacy concern?
Our designated Data Protection Officer and Article 27 representative is our CTO, Andrew J. Holden.
Please send any concerns, questions or complaints via email to:
- Andrew J. Holden
- office '/at/' weeverapps
or by regular mail:
Weever Apps Inc.
Attention: Privacy Officer
120 Hughson St. S
Hamilton, Ontario L8N 2B2
4. Policy information
Approved by:
- Steve McBride, CEO, Weever Apps Inc.
- Andrew J. Holden, CTO and Document Management, Weever Apps Inc.
Version History
- v1: 2019-08-01: Original
- v2: 2019-08-04: Updated approvers list
- v3: 2020-10-01: 24 Month review (unchanged)
- v4: 2021-08-01: Updated approvers list
- v5: 2021-11-04: Clarified contractor rules
- v6: 2022-02-16: Moved policy to web site
- v6: 2022-08-09: Annual review (no changes)
- v7: 2023-08-09: Clarified "Process" product name
- v9: 2024-01-27: Updated to match policy v9 (DPF statement)
- v10: 2025-04-01: Updated to cover SCC and DPA rules
- v11: 2025-06-10: General non-sensitive access reviews are quarterly (modification)
- v12: 2025-06-11: Update office address
- v13: 2025-08-01: Review only, no changes
-%20smaller.webp)
Why Autonomous Maintenance Programs Die in Month Four
The launch goes well. Week one, operators are interested. The checks are new, someone from corporate visited, there was a kickoff meeting with coffee. Completion sits near 100 percent. Month two, still good. Month three, a supervisor mentions that the night shift has been behind, but the numbers look fine so nobody digs.
Month four, the program is dead. Not cancelled, dead. The forms still exist. The schedule still generates checks. Completion still reports somewhere in the nineties. And nobody in the plant believes the number, including the person who reports it.
Well-run AM programs cut breakdown frequency by 30 to 50 percent in the first year and lift OEE 15 to 25 percent within two years of sustained practice. Almost none of that value accrues in the first ninety days. It accrues in the years after, which means the entire return on your program depends on surviving the thing that happens in month four.
Here is what actually kills it, in the order it usually happens.
Failure one: the loop never closed
An operator finds something. A weeping seal, an unusual noise, a guard that rattles. They report it, which is exactly what you trained them to do.
Then nothing visible happens.
Maybe it got fixed and nobody told them. Maybe it went into a queue. Maybe the form sat in a tray. From the operator's side these are indistinguishable, and all three teach the same lesson: reporting is paperwork, not action.
This is the root cause of most AM decay, and it is not a motivation problem. It is a feedback problem. People stop doing things that appear to have no effect. If reported abnormalities are not visibly actioned, reporting dries up, and once reporting dries up you have lost the entire early-warning function of the program while keeping all of its administrative cost.
The cost of a paper AM program is not the paper. It is the abnormality that got reported, filed, and never fixed, until it became the breakdown you did not see coming.
The fix is unglamorous: the person who reported the issue has to be able to see what happened to it, without asking. Not a monthly summary. The specific item they raised, and its status.
Failure two: the checks were never completable
Somebody built the CIL form with the best intentions and put forty inspection points on it. It takes twenty-six minutes. The shift has four.
What happens next is predictable and it is not dishonesty. The operator triages. They do the eight points that matter, and they mark the rest complete because the alternative is submitting an incomplete form and having a conversation about it. Within a month, the entire form is being completed in ninety seconds.
This is pencil-whipping, and it is a design failure rather than a character failure. The tell is a completion rate that stays high while abnormality reports fall toward zero. High completion and low findings is not a healthy program. It is a program that has stopped looking.
The remedy is ECRS: eliminate, combine, reduce, simplify. Most lines have hundreds of potential inspection points and need somewhere between 5 and 20 of the highest-impact ones. Fewer points that actually get done beat comprehensive coverage that gets performed. We go deeper on scoping in how many centerline points your line actually needs.
Failure three: the standard aged out and nobody noticed
Equipment moves. A machine gets rebuilt, a new sleeve gets installed, a lubrication point relocates. The CIL form still asks about the old configuration.
Operators notice immediately, and the first time an operator is asked to check something that no longer exists, the form loses authority. Not just that step. The whole form. From then on it is treated as a bureaucratic artifact rather than a working instruction, and every subsequent step is completed with that assumption.
Paper makes this nearly impossible to prevent at scale. If your standards live in binders across four lines and three shifts, you cannot know which version anyone is holding.
Failure four: it depended on one person
Every dying program has a person whose name comes up. The CI lead who built it. The maintenance manager who chased completion every morning. The supervisor who cared.
Then they take a role at another site, and the program's institutional memory leaves with them, because it was never written down. Which components matter, why that centerline range and not the OEM default, what the workaround is on line three. This is the same reason experienced operators taking tribal knowledge with them hurts so much, and food manufacturing has lost roughly 15 percent of its workforce since 2020, so this is not a hypothetical.
If the program cannot survive one person's departure, it is not a program. It is that person's habit.
Failure five: the data could not answer a question
At some point a plant director asks a reasonable question. Which equipment keeps generating the same issue? Which inspection points fail most often? Are our fixes holding?
If the answer requires someone to spend a day with a spreadsheet, they ask twice and then stop asking. And once leadership stops asking, the program loses its only external pressure. It becomes something the floor does rather than something the plant manages, and things in that category get dropped the first week production gets tight.
The four numbers that tell you it is happening
Completion rate will not warn you. It is the last number to fall. Watch these instead:
- Abnormality reports per week. Should be stable or rising as operators get better at seeing. A decline is your earliest and most reliable warning sign.
- Average time from report to confirmed fix. When this stretches, reporting is about to fall. It is a leading indicator of the leading indicator.
- Repeat issues on the same equipment. Tells you whether fixes are holding or whether you are re-reporting the same problem. Rising repeats with steady completion means the loop is running but not resolving.
- Completion time per check. If the average drops sharply, the checks are being performed rather than done.
Two of these are hard to get from paper at all, which is part of why paper programs decay invisibly. We break down the measurement side in more detail in how to reduce equipment downtime in manufacturing.
What programs that survive do differently
They are not more disciplined. They are built so that the right thing is the easy thing.
- Closure is visible to the reporter. Every issue traceable from submission to fix, by the person who raised it.
- The check fits the shift. Scoped with ECRS, 5 to 20 points, revisited when completion times start drifting.
- Standards live in one place and update everywhere. Including the reference photo of what correct looks like, attached to the step.
- Wins get shared. When AM catches a failure before it becomes downtime, that story gets told, ideally as a One Point Lesson with the operator's name on it. Recognition is the cheapest sustaining mechanism available and almost nobody uses it.
- Leadership asks a data question monthly and gets an answer in minutes. The pressure stays on because the answer is cheap to produce.
Why manufacturers use Weever to keep programs alive
The loop closes where operators can see it. Every reported abnormality is trackable from submission to closure by the person who reported it, which replaces finger-pointing with shared accountability.
Standards travel with the check. Reference photos, centerline ranges, One Point Lessons, and short videos live inside the form, so the current version is the only version anyone sees.
Participation holds. Site-wide pricing with unlimited users, no app install, no login, 11 languages, on shared devices. Customers report participation increases of 500 percent and more, and one site logged more than 100 abnormalities from 60 active users inside the first 90 days.
Questions get answered in minutes. Completion by line and shift, closure times, and repeat issues without compiling anything. One maintenance manager recovered roughly 30 percent of his day from reporting admin.
If you want the full picture of how the program holds together, our autonomous maintenance software page walks through it end to end.
Month four is a design problem, not a discipline problem
Programs do not die because operators stopped caring. They die because the system asked for more than a shift allows, gave nothing visible back, and could not answer the question that would have justified fixing it.
If your completion rate looks healthy but your abnormality reports have been falling, that is worth a look this week. Book a demo and bring your current CIL form. We will tell you honestly whether it is completable in the time your operators actually have.

How Many Centerline Points Should Your Line Actually Have?
Ask a reliability engineer how many centerline points a packaging line should have and you will get a thoughtful answer about criticality. Ask an operator and you will get a much shorter one: as few as possible.
Both are right, and the tension between them is where most centerline programs go wrong. Every variable you can measure looks worth measuring when you are building the form in an office.
On the floor, in the four minutes between a changeover and a run, a form with sixty readings on it does not produce sixty readings. It produces a habit of writing down what the value usually is.
The number that matters is not how many points you could monitor. It is how many get read accurately, every time, by someone who has other work. This article covers how to land on that number, how to decide which points earn a slot, and how to know when the count is wrong.
The short answer
For most lines, somewhere between 5 and 20 points. Some lines have hundreds or even thousands of candidate variables, and the useful range is a small fraction of them.
That number surprises people, and the instinct is to treat it as a compromise. It is not.
A tight set of points that are genuinely read tells you more about process stability than a comprehensive set that is partly fabricated, because fabricated data does not just fail to help. It actively misleads. A drifting value that gets recorded as its usual number is worse than a value nobody recorded, since one leaves a gap and the other leaves a false negative.
How to decide which points earn a slot
Apply ECRS, the lean four-step: eliminate, combine, reduce, simplify. Run every candidate variable through it.
1) Eliminate
Does anything change based on this reading? If a variable goes out of range and nobody would act differently, it is a measurement, not a control. Cut it. This alone usually removes a third of a first-draft list.
2) Combine
Are you reading three points that always move together? Pick the one that moves first. Redundant readings feel like rigour and cost you the same shift minutes as useful ones.
3) Reduce
Does this need reading every shift, or would weekly catch the drift in time? Frequency is a lever most programs never touch. A variable that drifts over weeks does not need a daily reading, and moving it to weekly buys you room for something that does.
4) Simplify
Can the operator get this reading without a tool, a ladder, or a guard removal? A point that requires effort to reach is a point that gets estimated. If it genuinely matters, make it reachable or accept that you are getting a guess.
What survives should meet three tests: the variable affects output quality or equipment health, drift in it is detectable before failure, and someone will act when it goes out of range.
Set the ranges from your own good shifts, not just the manual
Most equipment manufacturers provide optimal operating conditions, and those are the right starting point. They are not the right ending point.
The better approach, and the one experienced plants use, is what is often called Run the Target. When a shift runs well, document the settings. Not the OEM ideal, the actual configuration that produced a good run on your line, with your product, in your ambient conditions. Over time you build ranges that reflect your reality rather than a general specification.
Centerlining is part science and part accumulated experience, which is why the range you set in month one should not be the range you are still using in year two. Blending vendor baselines with your own production history is how you get limits that are tight enough to catch drift and loose enough not to cry wolf.
The signs your count is wrong
Too many points. Watch for completion time falling while completion rate stays high, readings clustered suspiciously close to the middle of the range, identical values submitted shift after shift, and out-of-tolerance findings approaching zero. That last one is the clearest tell. A form that never finds anything is not evidence of a stable process. It is evidence that nobody is looking.
Too few points. Watch for breakdowns and quality holds with no preceding signal in the data. If a failure investigation keeps concluding that a variable drifted and nobody was watching it, you have found a point that earned a slot.
The useful practice is to review the set quarterly against both lists. Add what failure investigations tell you to add, cut what has not found anything in six months.
Why this decision is harder on paper
On paper you cannot see any of the signals above. You get a stack of forms with numbers on them, and no way to know whether the numbers were read or remembered.
Three things change when readings are captured digitally at the machine. First, you see the value rather than a pass or fail, so drift is visible before it becomes a violation. Pass or fail without the number costs you every trend you might have found. Second, you get the time it took, which is your early warning that the form has outgrown the shift. Third, you can trend a single point across shifts and lines, which is how you find out that a variable is stable on line one and wandering on line three.
That last one is where the count gets genuinely smart, because the right number of points is not the same on every line, and you cannot know that without comparing.
For the mechanics of maintaining centerlines once they are set, see achieving process stability through centerlining. For where centerlines sit in the broader program, what autonomous maintenance is covers the three core activities.
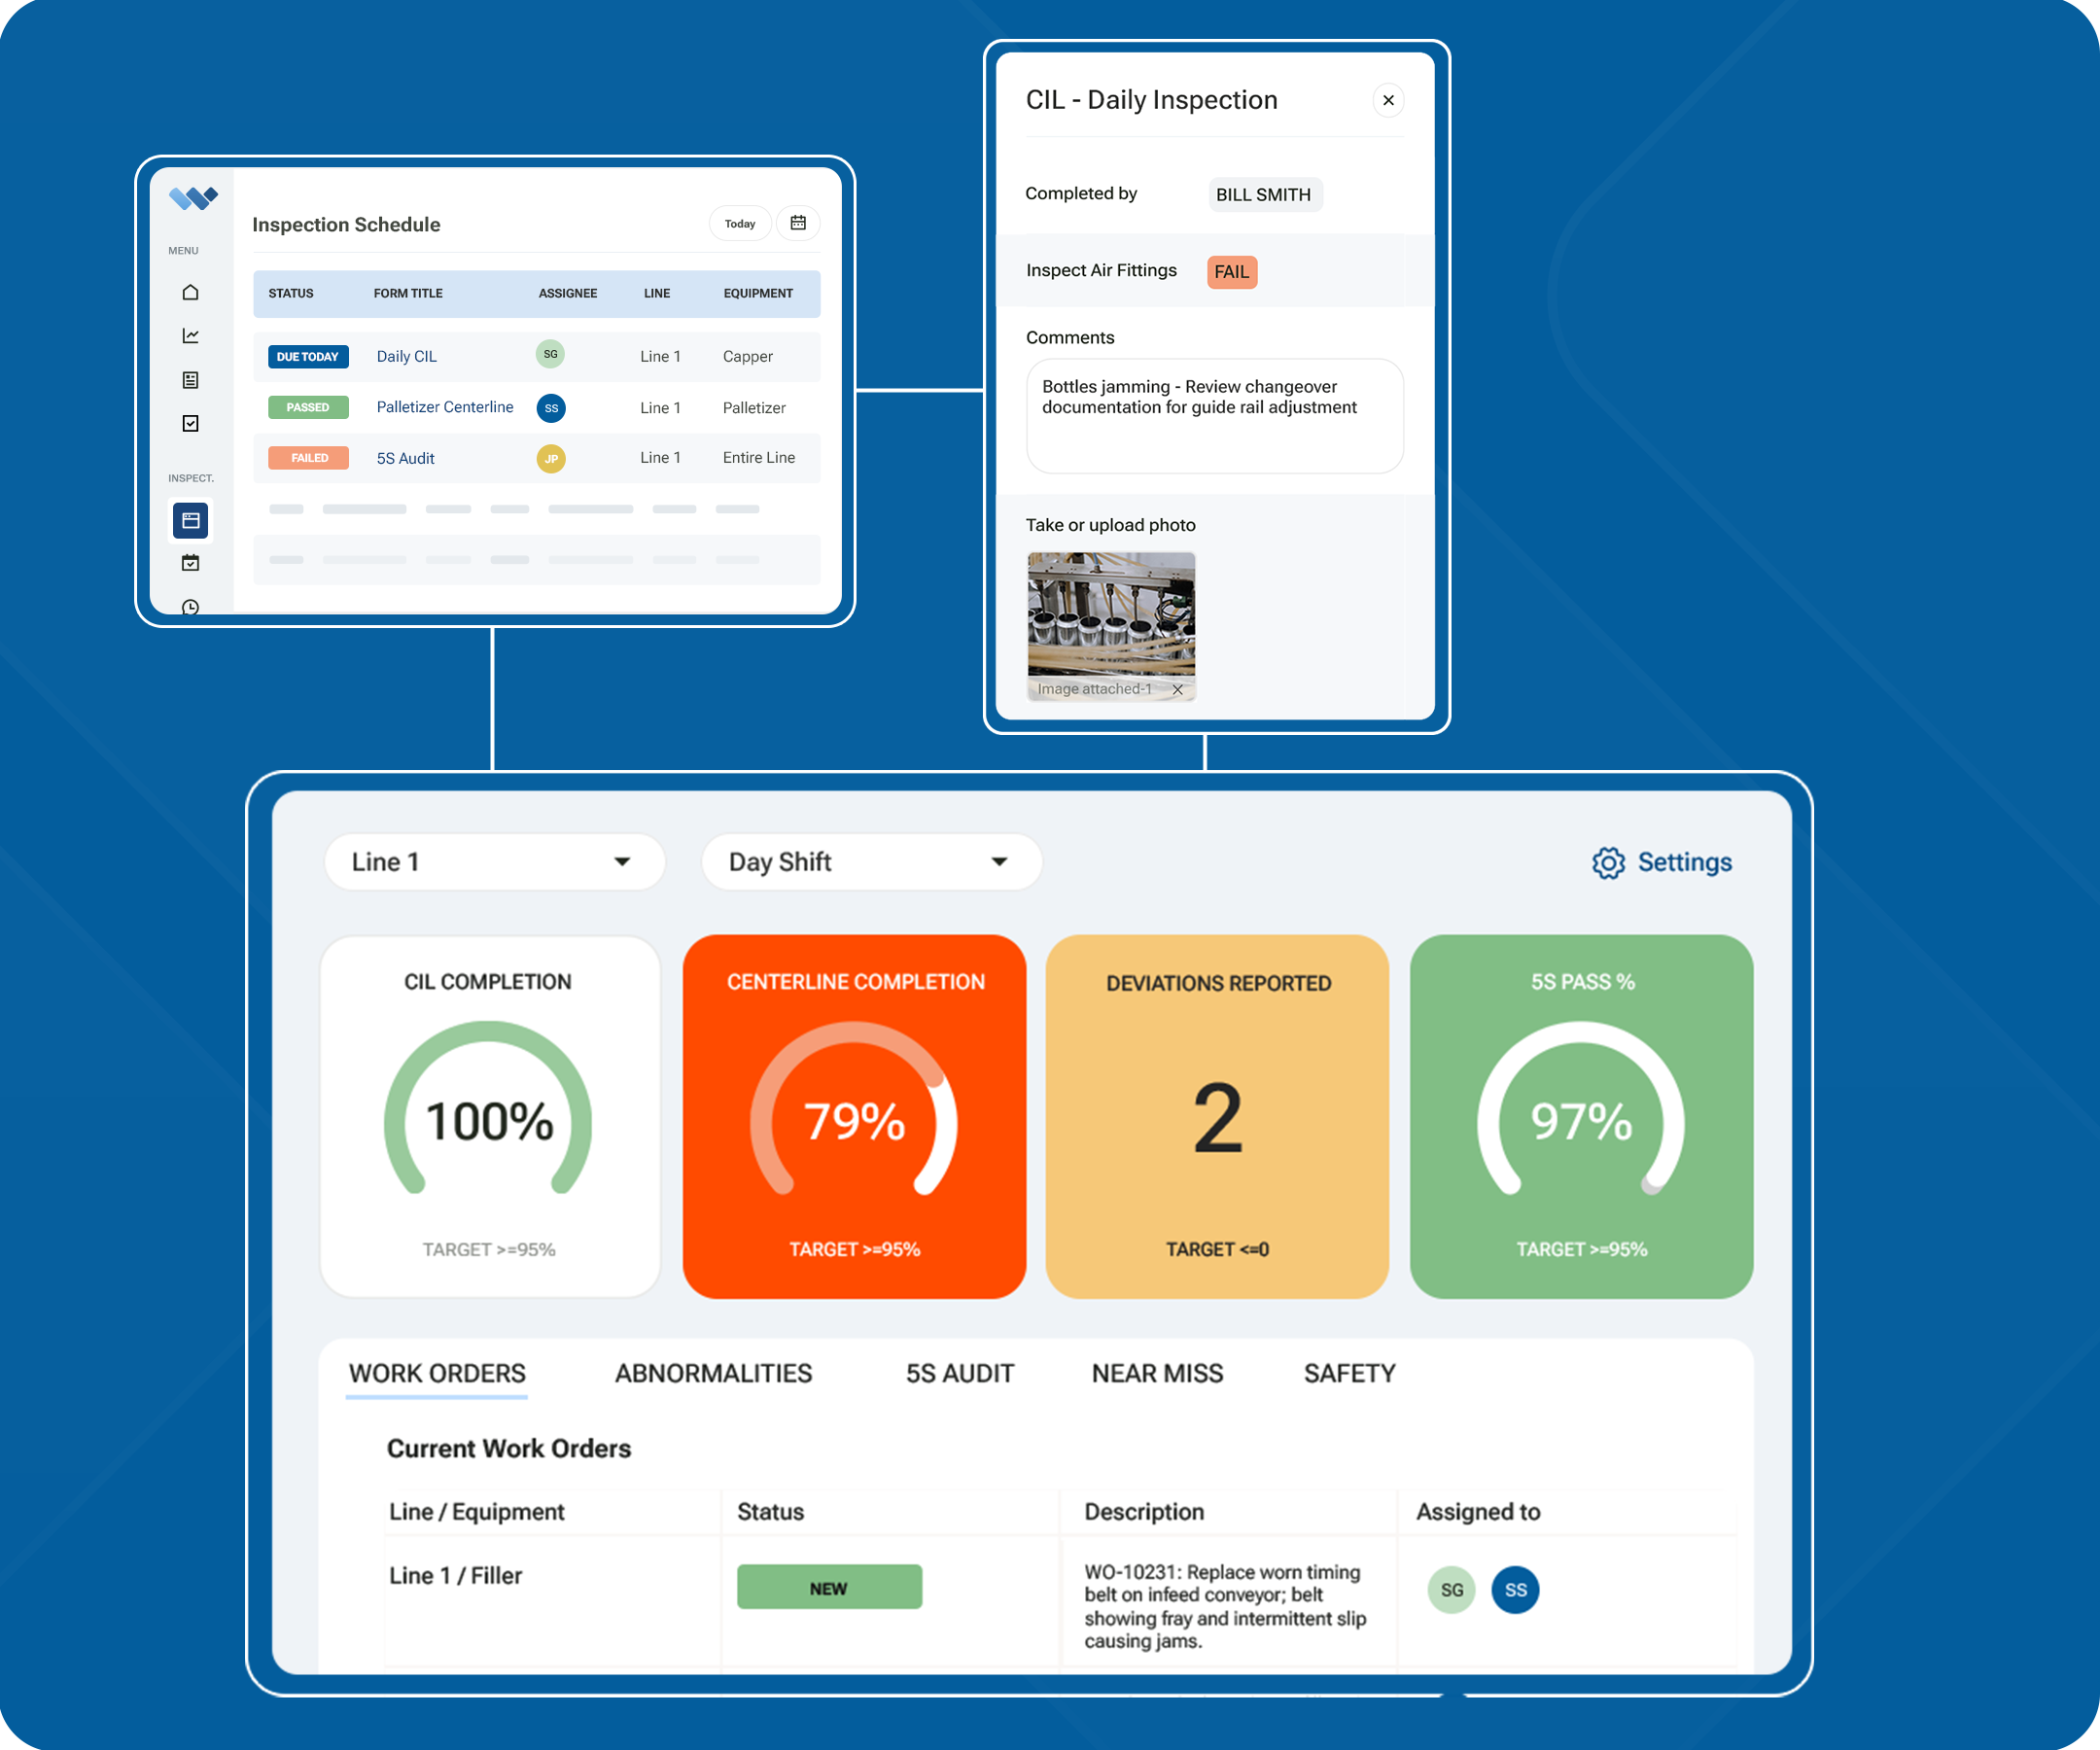
What the payoff looks like
Centerline discipline is unglamorous and it moves the numbers that matter. OEE is availability multiplied by performance multiplied by quality, and drifting settings attack all three: they produce stoppages, they rob speed quietly, and they generate defects. Food and beverage plants typically run at 55 to 65 percent OEE against an 85 percent world-class benchmark, and a meaningful share of that gap is variability nobody was watching closely enough to catch.
For scale, a 10-point OEE improvement on a packaging line is roughly 15 percent more production capacity with no capital investment. You do not get there by measuring more things. You get there by measuring the right small set accurately enough to trust.
Why manufacturers run centerlines on Weever
- The target range sits next to the field. Operators see the acceptable range as they enter the reading, so an out-of-tolerance value is obvious at the moment it is recorded rather than at month end.
- Readings are values, not checkmarks. Numeric capture means you can trend drift across shifts, lines, and sites instead of counting violations after the fact.
- Out-of-tolerance readings route themselves. With photos and context attached, straight to the person who can act, without anyone carrying a form to an office.
- Standards update everywhere at once. When a range changes, it changes in the form, so the current version is the only version on the floor.
- Weever RadarTM watches the whole stream. Every CIL, centerline reading, and abnormality report across your floor, finding the patterns nobody has time to dig for, so a drifting setting gets attention before it becomes a stoppage. And it is entirely your choice: Weever works exactly as it does today without Radar.
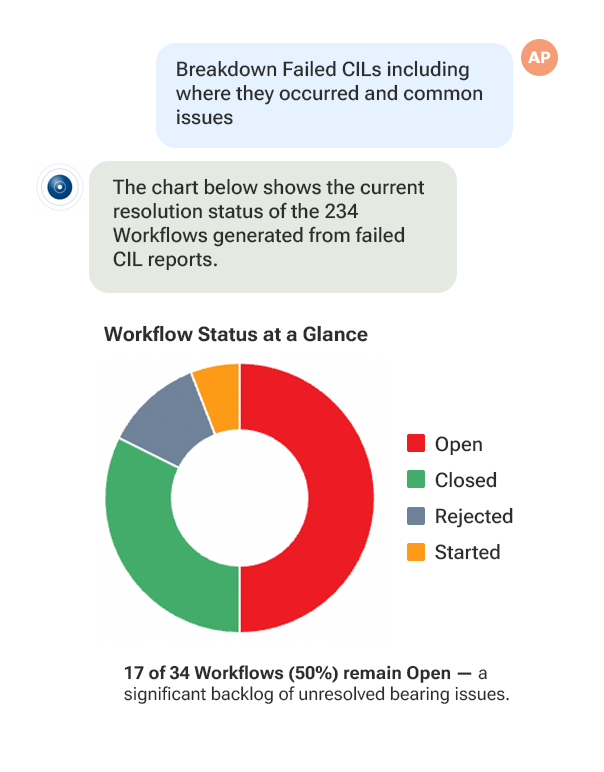
More on the full activity set on our autonomous maintenance software page.
Fewer points, read properly
The best centerline program on a line is the one where every reading on the form is a real reading. That almost always means a shorter form than the one you first drafted, reviewed quarterly, with ranges tuned from your own good shifts.
If you want a second opinion on your current point count, book a demo and bring your centerline form. We will walk it through ECRS with you and tell you which points we would cut.
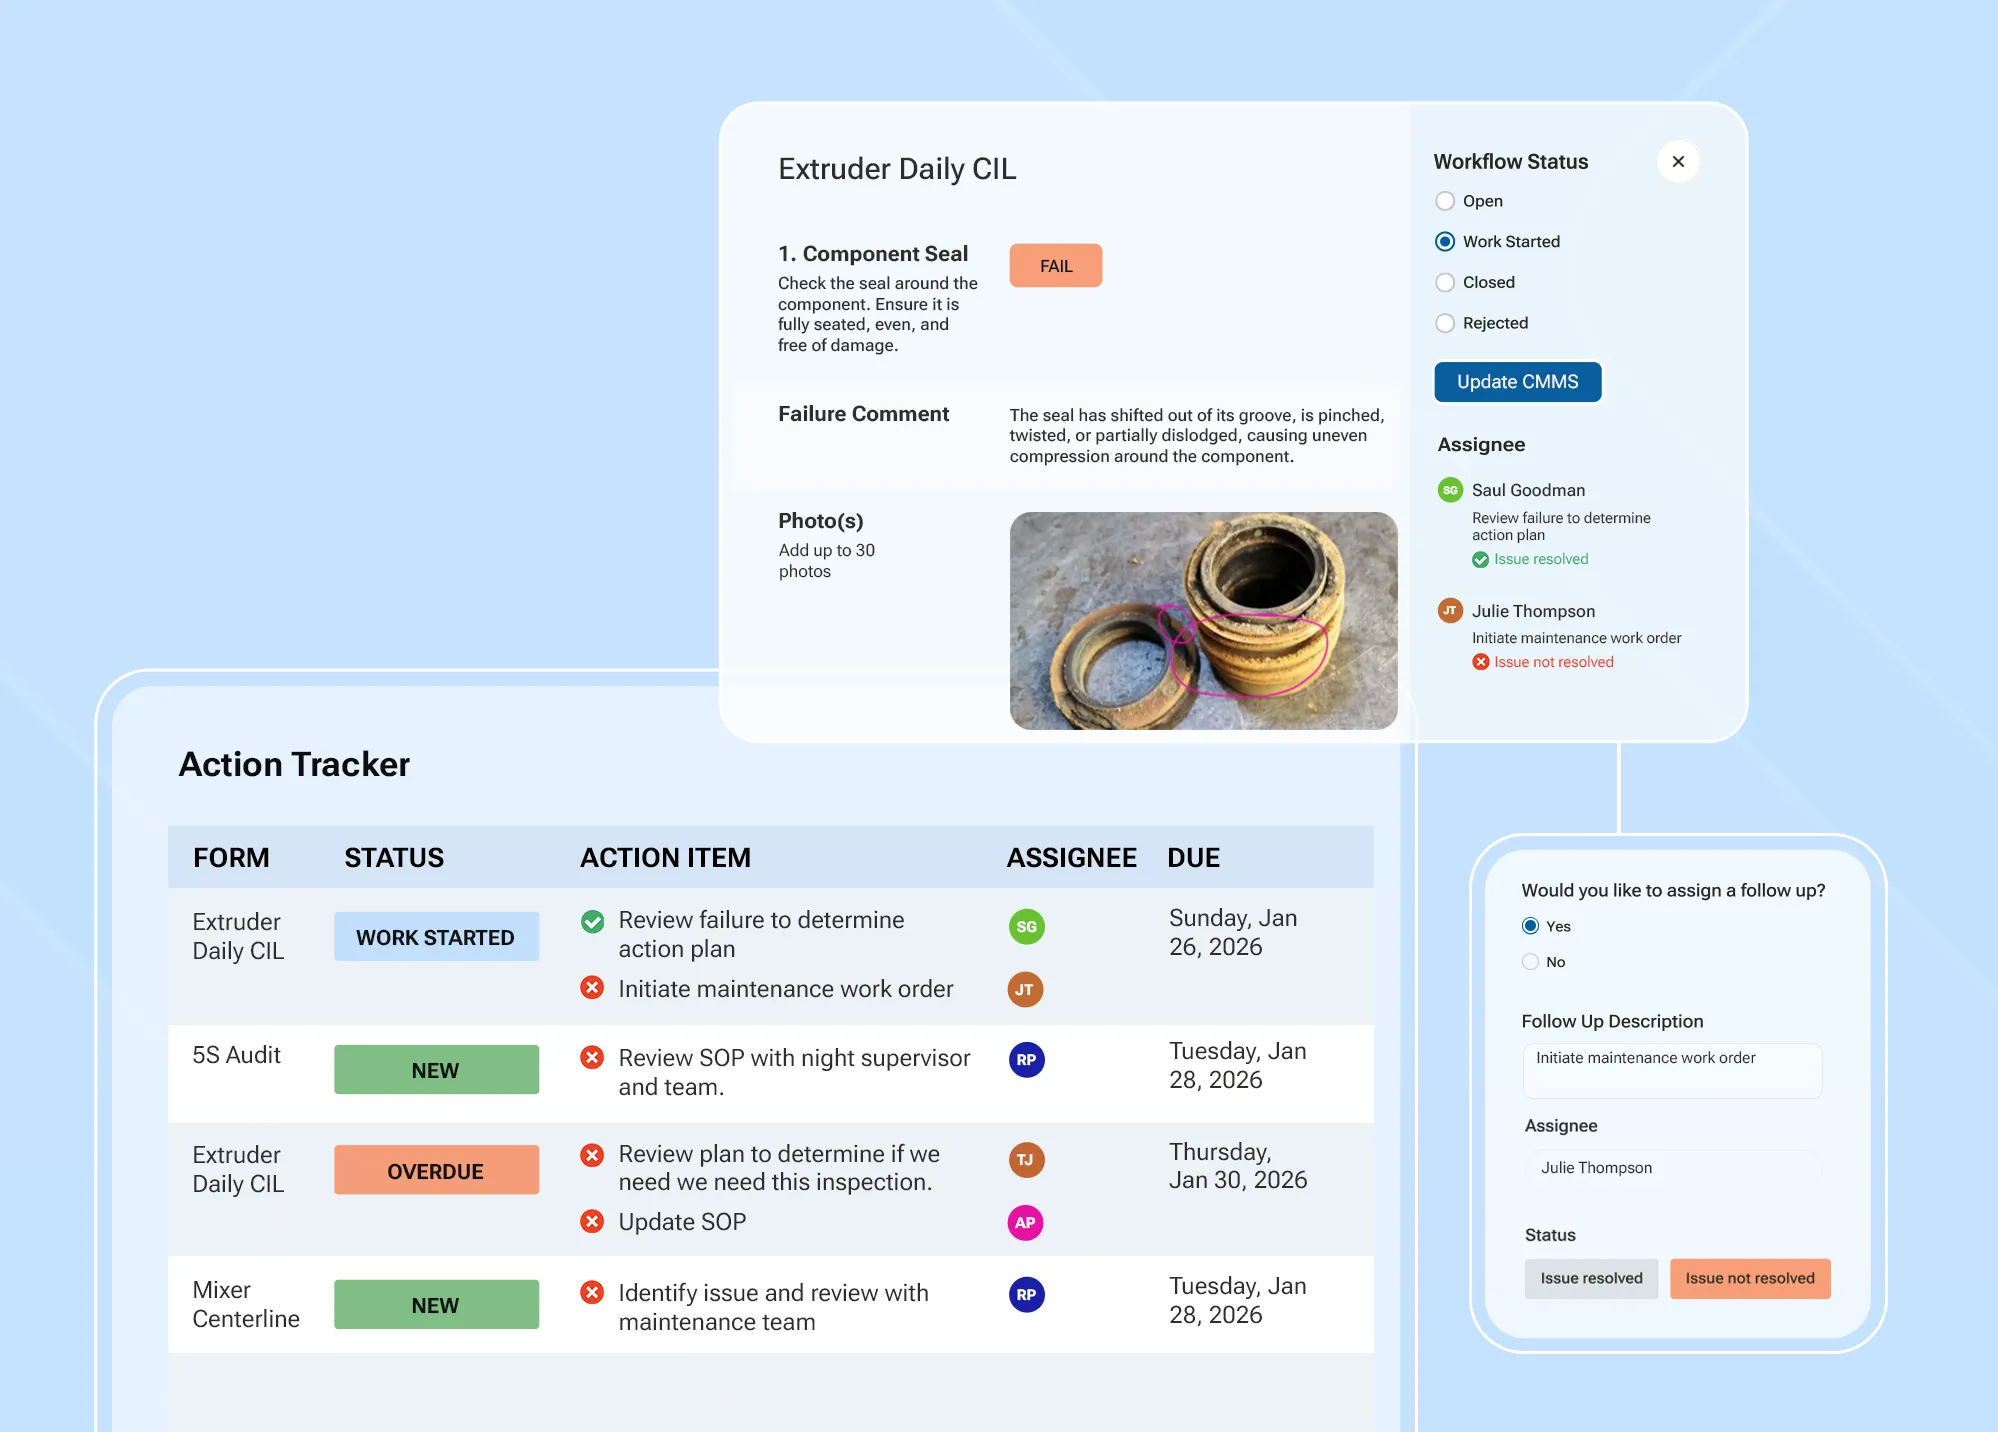
Autonomous Maintenance Software vs a CMMS in Manufacturing: What Each One Is Actually For
If you already run a CMMS, and someone just put an Autonomous Maintenance platform in front of you, your first question is the right one: why would we buy a second system to manage maintenance?
Here is the honest answer: A CMMS is built for the maintenance department. AM software is built for everyone else who touches the equipment.
- A CMMS is a system of record. It owns assets, work orders, parts, labour hours, and the reliability math that comes out of them.
- Autonomous Maintenance software is an execution layer. It owns what happens at the machine, on the shift, in the operator's hands: the CIL that got done or did not, the centerline reading that drifted, the abnormality someone noticed at 2am.
- Done right, the two feed each other. Done wrong, you have two systems and nobody trusts either.
This article breaks down what each system is actually built for, where the handoff between them belongs, and how to tell which gap you are actually trying to close.
The short answer, in one table
| What you need | CMMS | AM software |
|---|---|---|
| Asset registry and equipment hierarchy | Owns it | Reads from it |
| Work order lifecycle, labour hours, parts consumed | Owns it | Feeds it |
| MTBF, MTTR, cost per asset | Owns it | Supplies the input data |
| Parts and inventory management | Owns it | Not its job |
| Scheduled operator CILs, 5S and centerline rounds | Weak or unused | Owns it |
| Guiding an operator through a check at the machine | Not built for it | Owns it |
| Photo and video evidence at the point of work | Rare | Owns it |
| Abnormality capture by operators, not technicians | Awkward | Owns it |
| Completion data by line, shift, and equipment | Partial | Owns it |
| Participation across a whole plant floor | Licensed per seat, so limited | Site-wide by design |
Why the CMMS is usually not where AM lives
Most plants we work with have a CMMS, and most of them tried to run their AM program inside it first. It rarely holds, for four practical reasons.
Per-Seat vs. Site-Wide Licensing
CMMS platforms are priced per seat because they were designed for a technician headcount. AM asks 200 operators across three shifts to complete checks. The moment you price that per seat, someone decides only supervisors get logins, and now operators are dictating findings to a supervisor who types them in later. The data is secondhand before it is a day old.
Computer vs. Device Agnostic Interface
A CMMS work order screen assumes a trained technician with a laptop and time. An operator has a shared tablet, a running line, gloves, and four minutes. If it is not easy for them, it is not getting done.
Scheduling logic
CMMS PM scheduling is built around asset calendars and, in mature systems, meter readings. AM scheduling is built around shifts and lines. When the line is down for changeover, the checks for that line and shift need to come off the board, or your completion rate reports noise instead of performance.
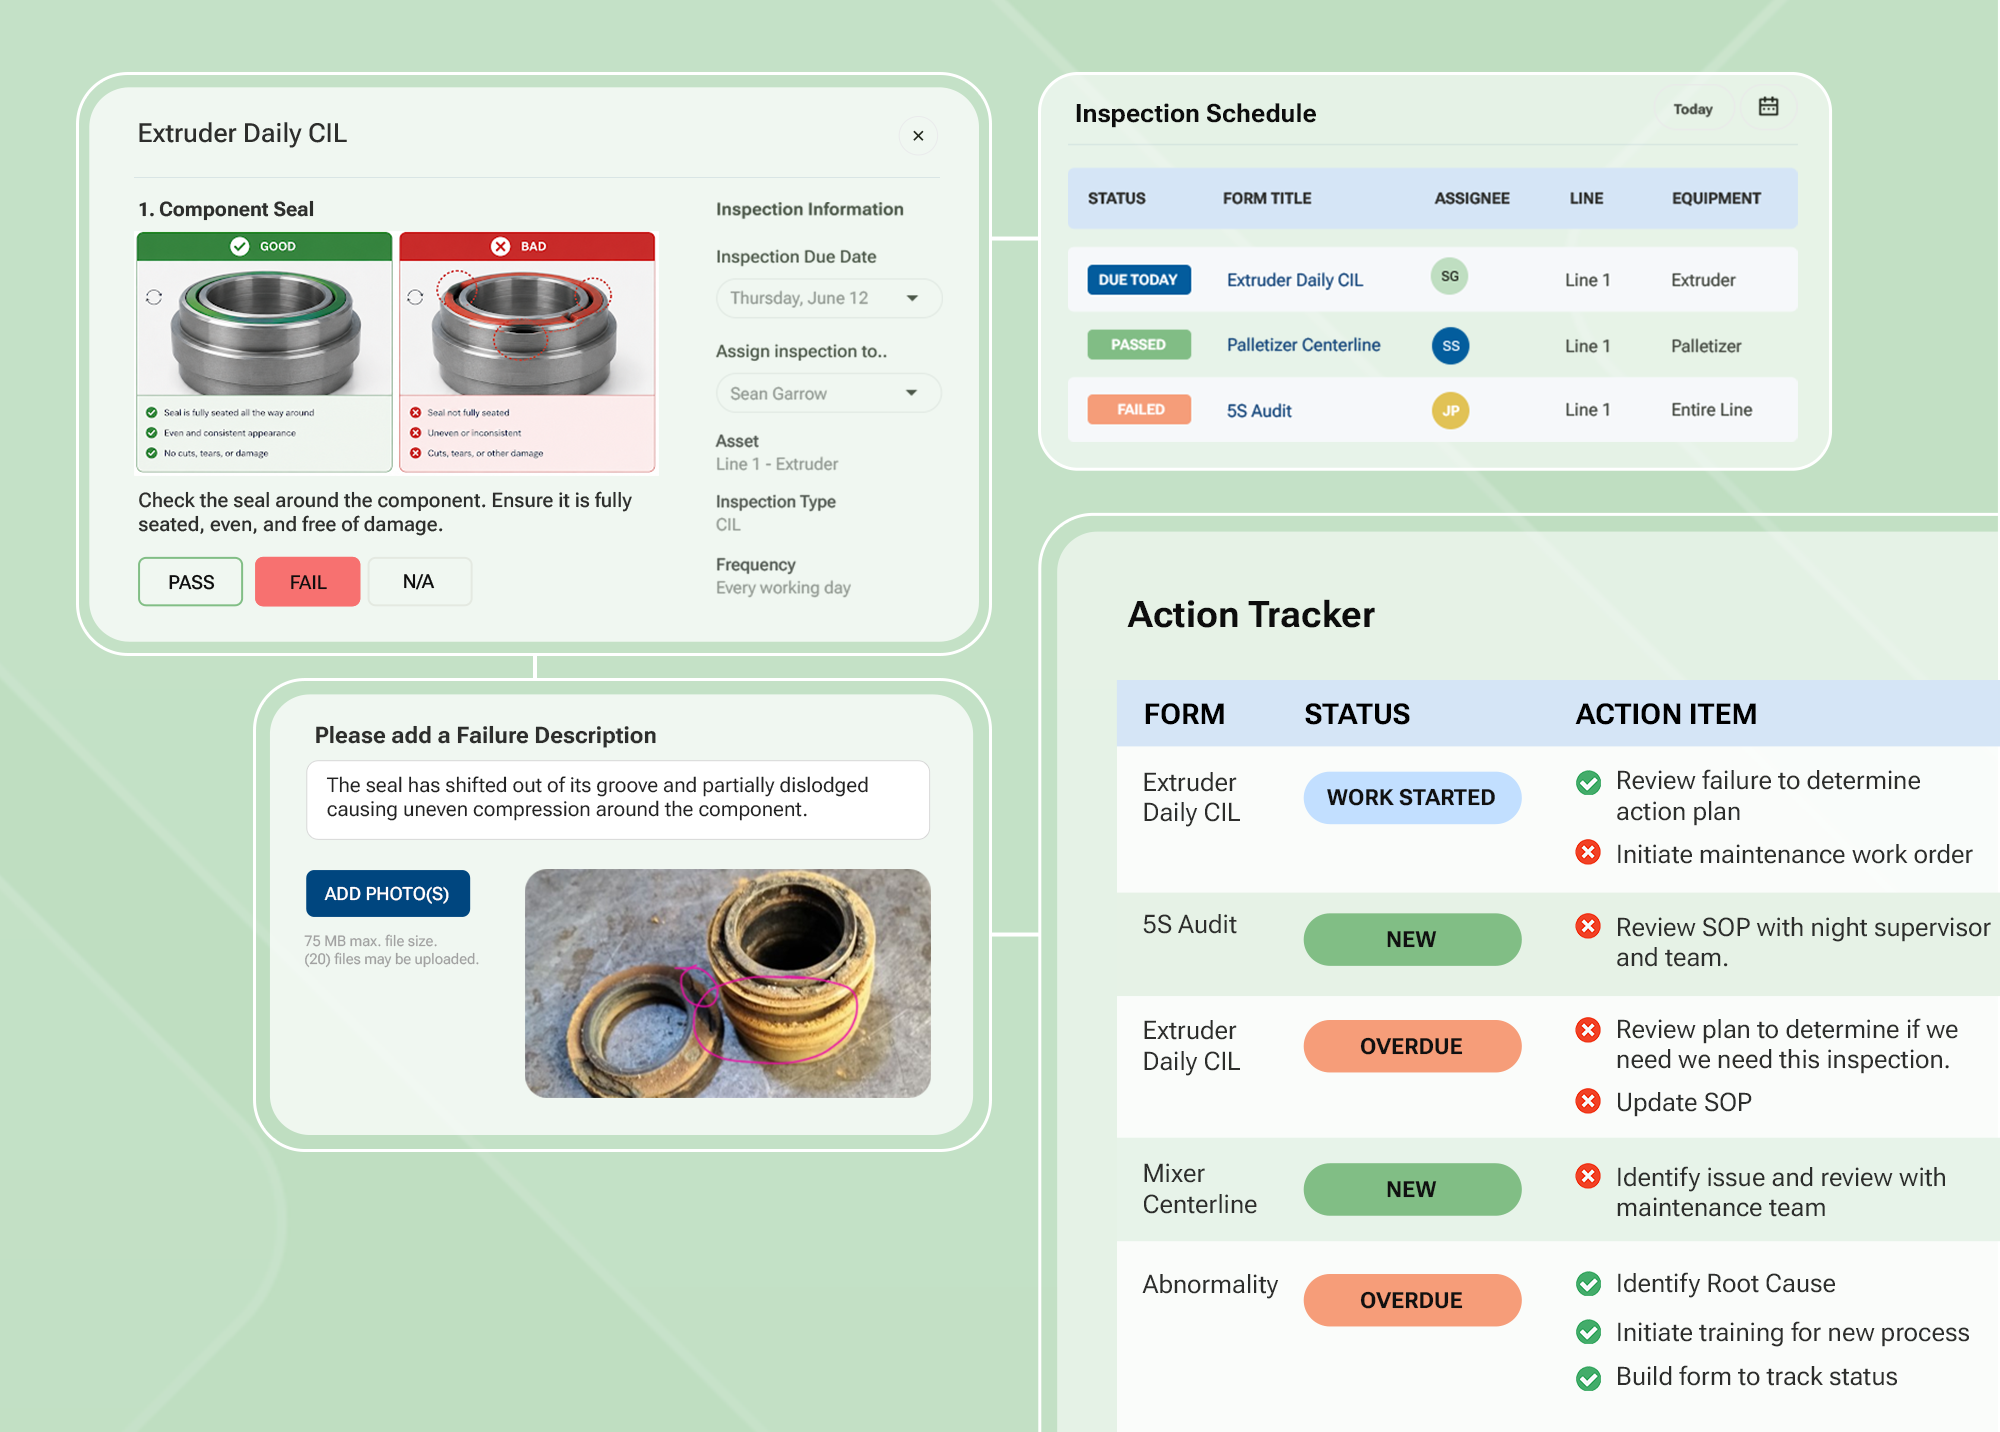
Closure vs. Evidence
A CMMS records that a PM was closed, the inventory used and a description of the work completed. AM evidence proves that a check happened at the machine, with a reading, with a photo. Closure and evidence are not the same claim.
The CMMS tells you what maintenance did. Autonomous Maintenance software tells you what the floor saw. You need both, and only one of them is where operators live.
Where the handoff actually belongs
The clean division of labor looks like this, and it is the same at almost every plant:
- The operator finds something. A failed CIL step, an out-of-tolerance centerline reading, an abnormality: unusual noise, vibration, a leak, a guard that is loose.
- Autonomous Maintenance software captures it with context. Photo, annotation, line, equipment, shift, time, who found it. This is the part paper cannot do, because a checkmark is a claim rather than proof.
- The issue routes automatically. The right person is notified without anyone walking a form to an office.
- The CMMS takes it from there when the fix needs a work order, parts, or technician hours. Weever pushes into CMMS, ERP, and BI tools so failed checks and defects flow through without duplicate entry.
- Closure loops back to the operator. They see what happened to the thing they reported. This is the step most programs skip, and it is the reason reporting dries up. If reported abnormalities are not actioned visibly, operators stop reporting.
- Both data sets get analyzed. The CMMS gives you cost and reliability math. The AM layer gives you the leading indicators: which inspection points fail most, which shift catches the most, which equipment keeps generating the same abnormality.
Step 5 is worth dwelling on. It is not a technical requirement. It is the difference between a program that compounds and a program that quietly dies, which we cover in more detail in why AM programs die in month four.
What each system is genuinely better at
The CMMS wins on:
- Asset history in one place
- Work order cost
- Parts and inventory
- Technician labour tracking
- Meter-based PM triggers
- Structured failure codes
- Reliability KPIs
If those are the gaps you are trying to close, buy a CMMS. AM software will not do that work, and any vendor telling you otherwise is selling you a second problem.
Autonomous Maintenance software wins on:
- Getting the check done correctly by someone who is not a technician
- Capturing what they saw with evidence attached
- Routing it in seconds
- Giving you completion data you can defend in a review.
Also on participation, because site-wide access with no per-seat licenses and no app install is what lets a whole floor take part.
The reason this matters for reliability is that most of your equipment intelligence is generated by people who will never open your CMMS. McKinsey has found that proactive maintenance approaches can cut machine downtime by 30 to 50 percent and extend machine life by 20 to 40 percent. That gain does not come from better work order forms. It comes from earlier detection, and detection happens at the machine.
Why manufacturers run Weever alongside their CMMS
Built for the floor, not the maintenance office.
Shared devices, no app install, no login, 11 languages. Site-wide pricing with unlimited users, because full participation is what makes the program work.
Designed to feed, not replace.
Weever pushes clean data into Power BI, corporate EHS, ERP, and CMMS platforms, so failed checks and defects become work orders without anyone entering them twice.
Live in weeks, not quarters.
Customer Success builds the first version of your forms. Admin training runs about an hour. Operators pick it up in minutes.
Proof at scale.
22 million jobs completed on the platform across 100,000 users. Customers report 500 percent or more increases in AM participation, and one maintenance manager reclaimed roughly 30 percent of the day previously lost to reporting admin.

If you want to see the execution layer specifically, our autonomous maintenance software page walks through how CILs, centerlines, abnormality capture, and closure work on one system.
The Bottom Line
You are not choosing between a CMMS and Autonomous Maintenance (AM) software. You are deciding which layer of your maintenance program is currently invisible, and buying for that. The CMMS holds the record. AM software makes sure the record reflects what actually happened on the floor.
Want to see how the two fit together on your lines? Book a demo and bring your current CIL forms. We will show you where the handoff lands in your setup.
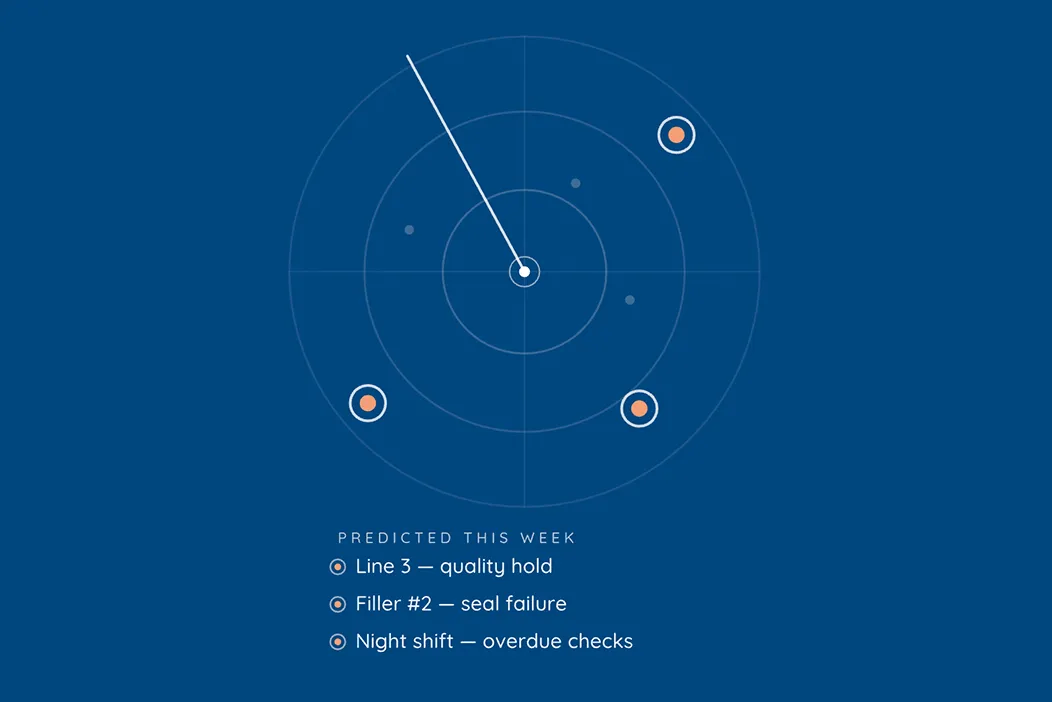
How to Use AI to Improve Your Continuous Improvement Programs in Manufacturing
If you own continuous improvement across one plant or twenty, you may not be short on frontline data, but you are probably short on answers.
Your teams complete thousands of CIL checks, 5S audits, sanitation sign-offs, safety observations, and quality inspections every month. Somewhere in there is the answer to the question you actually care about: where is the next failure coming from, and what should my team do about it this week.
But getting that answer means pulling exports, rebuilding the same spreadsheet, and waiting on someone who has time to dig. By the time the report lands, the shift it describes is two weeks gone.
That gap is what Weever Radar closes. This article walks through what Weever Radar is, where it fits in the continuous improvement loop, and the specific questions you can ask it to find real improvements in your facility today.
What is Weever RadarTM?
Weever RadarTM is the operational intelligence layer inside Weever, built for supervisors, managers, and plant leaders and powered by AI.
It turns the frontline data your team already captures in Weever into immediate answers, insights, and recommendations you can act on. It runs on the data you already have: safety observations, sanitation sign-offs, 5S and 6S audit scores, AM and CIL checks, quality inspections, and every corrective action attached to them. You ask a question in plain language and Weever Radar answers in seconds, with the context you need to act with confidence.
A dashboard shows you a number. Weever Radar tells you what is happening, what it means, and what to do about it, across every line, shift, and site at once.
It is also optional. Weever works exactly as it does today without Weever Radar, so you decide if and when AI is right for your plant, and you stay in control the entire time.
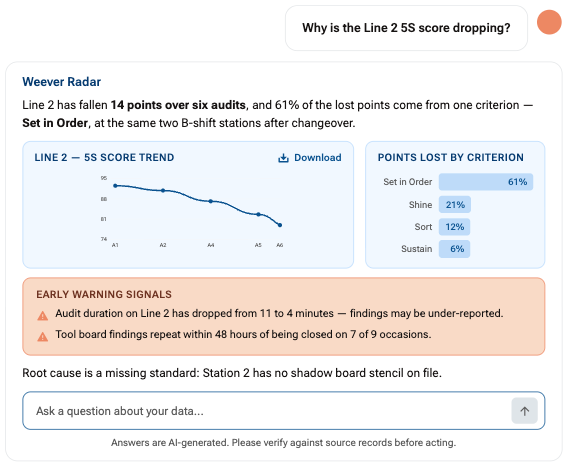
Where continuous improvement actually breaks down
Most CI programs do not fail at the idea stage. They fail at the analyze stage, and they fail quietly.
The frontline captures the work. Issues get raised. Then the data lands in five different places, in five different shapes, and nobody has the hours to connect it. So decisions get made on the loudest problem instead of the most expensive one.
Three things break in sequence:
- The admin tax. Supervisors and CI managers spend a large share of their week on manual data entry, spreadsheet upkeep, and report building. In sanitation alone, one Weever customer was losing 18 hours a week, 933 hours a year, to manual scheduling, chasing logs, and assembling audit reports before going digital.
- The context gap. Machine and sensor data tells you the what. The human operational context, the why, is the hard part, and it is usually stranded on paper or siloed in a legacy system. Without the why, you cannot fix a root cause. You can only react to a symptom.
- The engagement drop. When flagged issues go nowhere, people stop flagging them. Participation falls, the data thins out, and the program becomes a rubber stamp. Then every downstream insight is built on incomplete records.
The bottleneck in continuous improvement was never a shortage of data. It was the time between asking a question and getting an answer you trust.
Enabling the Continuous Improvement Loop
Weever Radar works at every stage of the loop, not just the last one.
Weever runs on a loop: capture what happens on the floor, act on every issue, analyze it all together, then do it again. Each cycle sharpens the next. Most people assume an AI layer only touches the reporting end of that loop. Weever Radar drives value at all three stages.
Capture
"For our last ten failures on Line 3, what information was missing that would have helped explain them?"
Find out what you should have been capturing. Nobody designs a perfect form. You build a check based on what mattered at the time and it runs unchanged for three years. Ask Weever Radar why a task keeps failing and a thin answer tells you something useful: the form never captured who was on shift, what equipment state they found, or a photo of the condition. The caveats in Weever Radar's answer are a list of the fields you are missing.
Weever Radar can also show you which fields return the same answer on nearly every submission and which checks have never once produced a fail. Those are costing seconds per submission across thousands of submissions a month and returning nothing. Cut them.
Act
"Suggest potential root causes for the five most recent failures."
Fix the cause, not the ticket. Weever already gives every failed check an owner, a due date, and follow-through tracked to closure. The harder question is whether you fixed the problem or just closed the record.
Weever Radar connects the activity to what is likely driving it. One customer's most-failed sanitation task was not failing because the standard was unclear. It was failing because it landed at the end of shift, every time, with no time left to do it properly. Coaching would never have fixed that. Moving it in the schedule did.
Analyze
"What patterns across our programs should I be paying attention to that I have probably missed?"
See it coming, and see what you were missing. Weever Radar points you to the recurring finding, the missed check, and the line trending toward trouble, so problems get caught before they become downtime, a hold, or an audit finding. Ask what is likely and you get a confidence level and the caveats stated plainly.
It also reads across programs. Because safety, sanitation, 5S, AM, and quality data all land in one structure, Weever Radar can find the patterns sitting between them, the joins nobody built a chart for. Every insight links back to the source records, so when your plant manager asks where the number came from, you can show them the sign-off and the photo behind it.
The loop only compounds if every stage feeds the next. Weever Radar is what keeps that momentum: sharpening what you capture, giving weight to how you act, and turning analysis into next cycle's standard.
Know the Unknown
Dashboards answer the questions you thought to ask. Weever Radar surfaces the ones you did not.
Every dashboard in your plant is an answer to a question somebody already asked. Someone decided what mattered, picked the fields, built the chart, and pinned it to a page. That is genuinely useful, and it is also the ceiling. A dashboard can only ever tell you the thing you asked to be told.
That covers your known unknowns. You know you do not know this month's 5S score for Line 4, so there is a tile for it. You know you do not know your overdue corrective action count, so there is a chart for that too. Those questions get answered because somebody anticipated them.
The problem is the other category. The insight that would have saved you the most money this quarter is almost never on a dashboard, because nobody suspected it was there to find. Nobody builds a chart joining night shift rotation to changeover defect rates. Nobody thinks to plot sanitation task timing against quality holds. The pattern sits across two programs that report separately, in two formats, owned by two different people, so it stays invisible.
Weever Radar reads across all of it at once. Because every program captures data in the same structure, safety observations, sanitation sign-offs, 5S scores, CIL checks, quality inspections, and every corrective action attached to them, Weever Radar is not limited to the fields someone chose to put on a page. It can connect things nobody thought to connect.
Weever Radar does not invent these connections. It finds them in the records your team already captured, which is exactly why the capture stage matters. Structure the data consistently across every program and the patterns are sitting there waiting. Leave it in binders and separate systems and no amount of AI will surface them.
Which makes the most valuable question the one you cannot ask a dashboard at all: "What patterns in our frontline data should I be paying attention to that I probably have not noticed?"
A Practical Guide to Working with Weever Radar
The 3 Levels of Weever Radar
Everything in Weever Radar starts with a question. It helps in three ways, and each one builds on the last: from a quick answer, to real understanding, to knowing your next move.
What you can ask Weever Radar today, program by program
This is the part worth sharing with your CI managers and supervisors. Below are the questions that produce an actionable answer on the first ask. Each one ends in a decision someone can make this week.
Autonomous Maintenance
5S and 6S Auditing
Sanitation and food safety
Safety and Behaviour-Based Safety Observations
Quality Checks
Cross-program and CI program health
The AI questions your team will ask
Everyone in manufacturing is being pitched AI right now, and your quality and IT leads are right to be sceptical. Good AI starts with good data, and good data starts with your people. Feed AI gaps and it will answer with confidence and get it wrong. Here is how Weever Radar handles the questions that come up in every evaluation.
Can we trust the answers?
Weever Radar runs on data captured at the source with photo evidence and timestamps, and wherever possible every insight links back to the source records so you can verify the observations and sign-offs behind it. Outputs are advisory. Your team makes the decisions.
Will our data be used to train AI?
No. Zero training is enforced at the infrastructure level. It is not a setting someone can switch off.
Where does our data go?
Data is processed only by models running in Weever's cloud. It is never sent to external AI services.
Is Weever Radar secure and compliant?
Weever Radar inherits Weever's existing security program: SOC 2 Type II certified, 21 CFR Part 11 commended, and aligned with GDPR and HIPAA.
Does Weever Radar touch our audit trail?
Weever Radar reads your data. It never alters records. The regulated audit trail required by standards like 21 CFR Part 11 stays intact.
Who can see what?
Weever Radar is permission based. If you do not want it to access certain data, it does not. When Weever Radar is off, none of your data is read or analyzed.
Do we have to use it?
No. Weever works exactly as it does today without Weever Radar. You decide if and when AI is right for your plant.
Why manufacturers choose Weever for this
The data is the moat, and it starts on the floor
Machine and sensor data is easy to collect and most plants already have plenty of it. The human operational context, the reason a check failed, is the hard part, and it is the part that makes an AI answer useful. Weever captures it at the source, in one consistent structure, across every program.
Adoption happens on the first shift
If operators will not use the system, none of this exists. Weever runs on shared devices with no login, in multiple languages, on whatever hardware your plant already has. Operators pick it up in minutes and admins train in about an hour.
Live in weeks, not months
Pilots in weeks, full rollout in a quarter. No developers, no servers, no IT project. You are not starting from a blank screen either: Weever builds your first workflows from your current process, your abnormality template, your CIL format, your SSOPs.
Your data stays yours
Weever spans the programs you already run, autonomous maintenance, safety and BBSO, sanitation, quality, and 5S and 6S auditing, on one platform instead of point solutions that cannot share data. It exports through OData, Excel, and MCP into the BI and enterprise systems you already have. We complement SAP, MES, historian, and CMMS. We do not replace them.
How to get value from Weever Radar in your first 30 days
- Pick one program and one question. Start with the program where your data is most complete, then ask the single question your last management review could not answer.
- Ask the follow-up. The first answer is a number. The second and third answers are where the improvement is. Train your supervisors to keep asking why.
- Verify against the source. Click through to the underlying records the first several times. Confidence in AI is built by checking it, not by being told to trust it.
- Change one standard. Use what Weever Radar surfaces to adjust one CIL route, one audit criterion, or one sanitation schedule. Then measure whether the failure rate moves.
- Give it to the supervisors. Weever Radar earns its keep when the person walking the floor at 6am can ask it a question before they leave the office, not when it lives with one analyst.
- Then widen it. Once one program is producing answers your team acts on, add the next. The dataset gets richer and the answers get sharper with every program you connect.
Where this leaves you
Continuous improvement has always depended on how fast you can turn what happened on the floor into what your team does next. The plants that connect their frontline data and act on it will pull ahead. The ones that do not will fall behind.
Want to see what Weever Radar finds in your own programs? Book a demo and we will walk through the questions your team would ask first, using your process, your programs, and your data structure.
If it is not on your radar, it is on Weever's.
10 Best 5S Audit Software and Apps for Manufacturing Plants [Reviewed & Compared]
Quick summary
5S audit software replaces paper checklists, whiteboards, and manual boards with scheduled digital audits, corrective action tracking, and real-time scoring. Most tools handle the audit itself fine. The real difference is what happens after: whether findings get closed, and whether a slipping score gets caught before it becomes the new normal. Here are our top three picks:
| # | Platform | Best for |
|---|---|---|
| 1 | Weever | Large, multi-site process manufacturers |
| 2 | Ease.io | Automotive and aerospace manufacturing |
| 3 | SafetyCulture | Small plants running 5S audits, looking for high free-tier limits |
Why plants are moving from paper to 5S inspection software
Every plant reaches a point where the same 5S issues keep showing up. Was this area actually audited this month? Who's supposed to fix the missing label on rack 4? Why does the same corner fail every quarter?
When those answers live on a paper checklist or a whiteboard nobody updates, teams spend their time chasing information instead of fixing the floor. With 5S audit software, those questions get answered automatically. Every audit is scheduled, every finding is assigned, and every score is visible the moment the walk is done.
The market offers plenty of tools for this, and that's where plants get stuck. In this guide, we'll explain what 5S audit software is and how the 10 best tools in 2026 compare.
Why listen to us?


.avif)
Weever was built by people who understand manufacturing from the inside. Our team is no stranger to factory floor challenges and have lived the problems plant leaders face every day: standards followed differently across shifts, audits completed without real attention, and findings that never make it to resolution.
That shows up in the results. At Adient's Liverpool plant, 5S scores climbed from 85% to 97% and monthly open issues dropped from over 60 to under 5 after moving off paper and Excel. Today, Weever supports 5S programs at companies including Adient, Royal Canin, Mars Snacking, and Monin. The feedback we receive from operators, supervisors, and plant managers gives us a practical view of what works on the floor, what creates friction, and what teams are likely to ignore.
What is 5S audit software?
5S audit software is a digital tool for scheduling, scoring, and documenting 5S audits. It replaces paper checklists and whiteboards that rely on someone remembering to update them.
The first four steps of 5S (Sort, Set in Order, Shine, and Standardize) help teams organize the work area and define how it should be maintained. The fifth step, Sustain, makes sure those standards continue across every shift. Regular 5S audits help teams catch missing labels, misplaced tools, blocked areas, and other signs that the workplace is slipping back into old habits.
Manufacturers use 5S audit software to run those checks against their own standards while capturing photos, red tags, findings, and corrective actions in the same workflow. This keeps follow-up connected to the original audit instead of leaving it to memory.
Platforms vary in scope. Some focus on completing audits, while others also include corrective action tracking, multi-site reporting, and integrations with existing systems. The strongest options work on shared shop-floor devices and support QR-code access, helping plants run audits consistently across shifts, languages, and sites.
How apps and software help with 5S auditing
Most plants running 5S manually aren't struggling with the method. They're struggling with paper forms, Excel trackers, and physical boards that all show a different version of the truth. An action gets flagged in one system, tracked in another, and forgotten in a third. Here's where dedicated software actually changes that.
- Keep audits on schedule: A recurring calendar by area, line, site, shift, or auditor replaces the "we'll get to it when things slow down" pattern that turns monthly audits into quarterly ones.
- Make inspections easier on the floor: Mobile checklists, QR-code access, shared devices, and offline mode take the audit out of a laptop and Excel, and put it where the work actually happens.
- Capture visual evidence: Photos with sketches and annotations replace the vague, text-heavy checklists ("good/very good") that made scoring inconsistent and subjective in the first place.
- Calculate scores immediately, and weight them: A safety or quality miss counts for more than a cosmetic one, so the score reflects real risk instead of treating every finding the same.
- Keep corrective actions moving: An owner, a due date, and reminders replace the "who's supposed to fix this?" gap that leaves action items sitting in Gensuite, ETQ, or a supervisor's inbox until someone remembers.
- Compare progress across areas and sites: One dashboard replaces the site-by-site, tool-by-tool patchwork that makes it nearly impossible to prove ROI or standardize how 5S runs across a multi-plant operation.
10 best 5S audit software and apps compared
| # | Platform | Best for | Starting price | Key differentiator |
|---|---|---|---|---|
| 1 | Weever | Large, multi-site process manufacturers | Custom, site-wide pricing | Configurable scoring and action tracking across 5S, AM, safety, sanitation, and quality, with AI-flagged score drift |
| 2 | Ease.io | Automotive and aerospace manufacturing | $720/site/month | Auditor qualifications and CQI-8/AS9100D compliance built in |
| 3 | SafetyCulture | Small plants running 5S audits, looking for high free-tier limits | Free (up to 10 users); $24/user/month paid | Large public template library across different manufacturing plant types |
| 4 | Lumiform | Digitizing existing inspection forms | $112/month | AI-assisted form creation, translation, and photo validation |
| 5 | GoAudits | Replacing paper inspections | $10/user/month | Free checklist conversion and branded report exports |
| 6 | Tulip | Plants already using Tulip for other shop-floor apps | $100/interface/month | 5S scores can sit alongside machine, sensor, and production data in the same dashboard |
| 7 | Alpha TransForm | Building custom mobile field apps | Free tier (up to 3 users); $30/user/month paid | No-code builder for fully custom field data apps |
| 8 | Inspectly360 | AI-assisted visual inspections | Custom (Growth/Enterprise tiers) | On-device AI flags defects and drafts the inspection record |
| 9 | Tervene | Lean daily management | Custom quote | Layered, leadership-based audit scheduling with escalation |
| 10 | Quentic | EHS and certification audits | Available upon request | Multi-country ISO certification and EHS compliance |
1. Weever - Best 5S software for multi-site process manufacturing plants
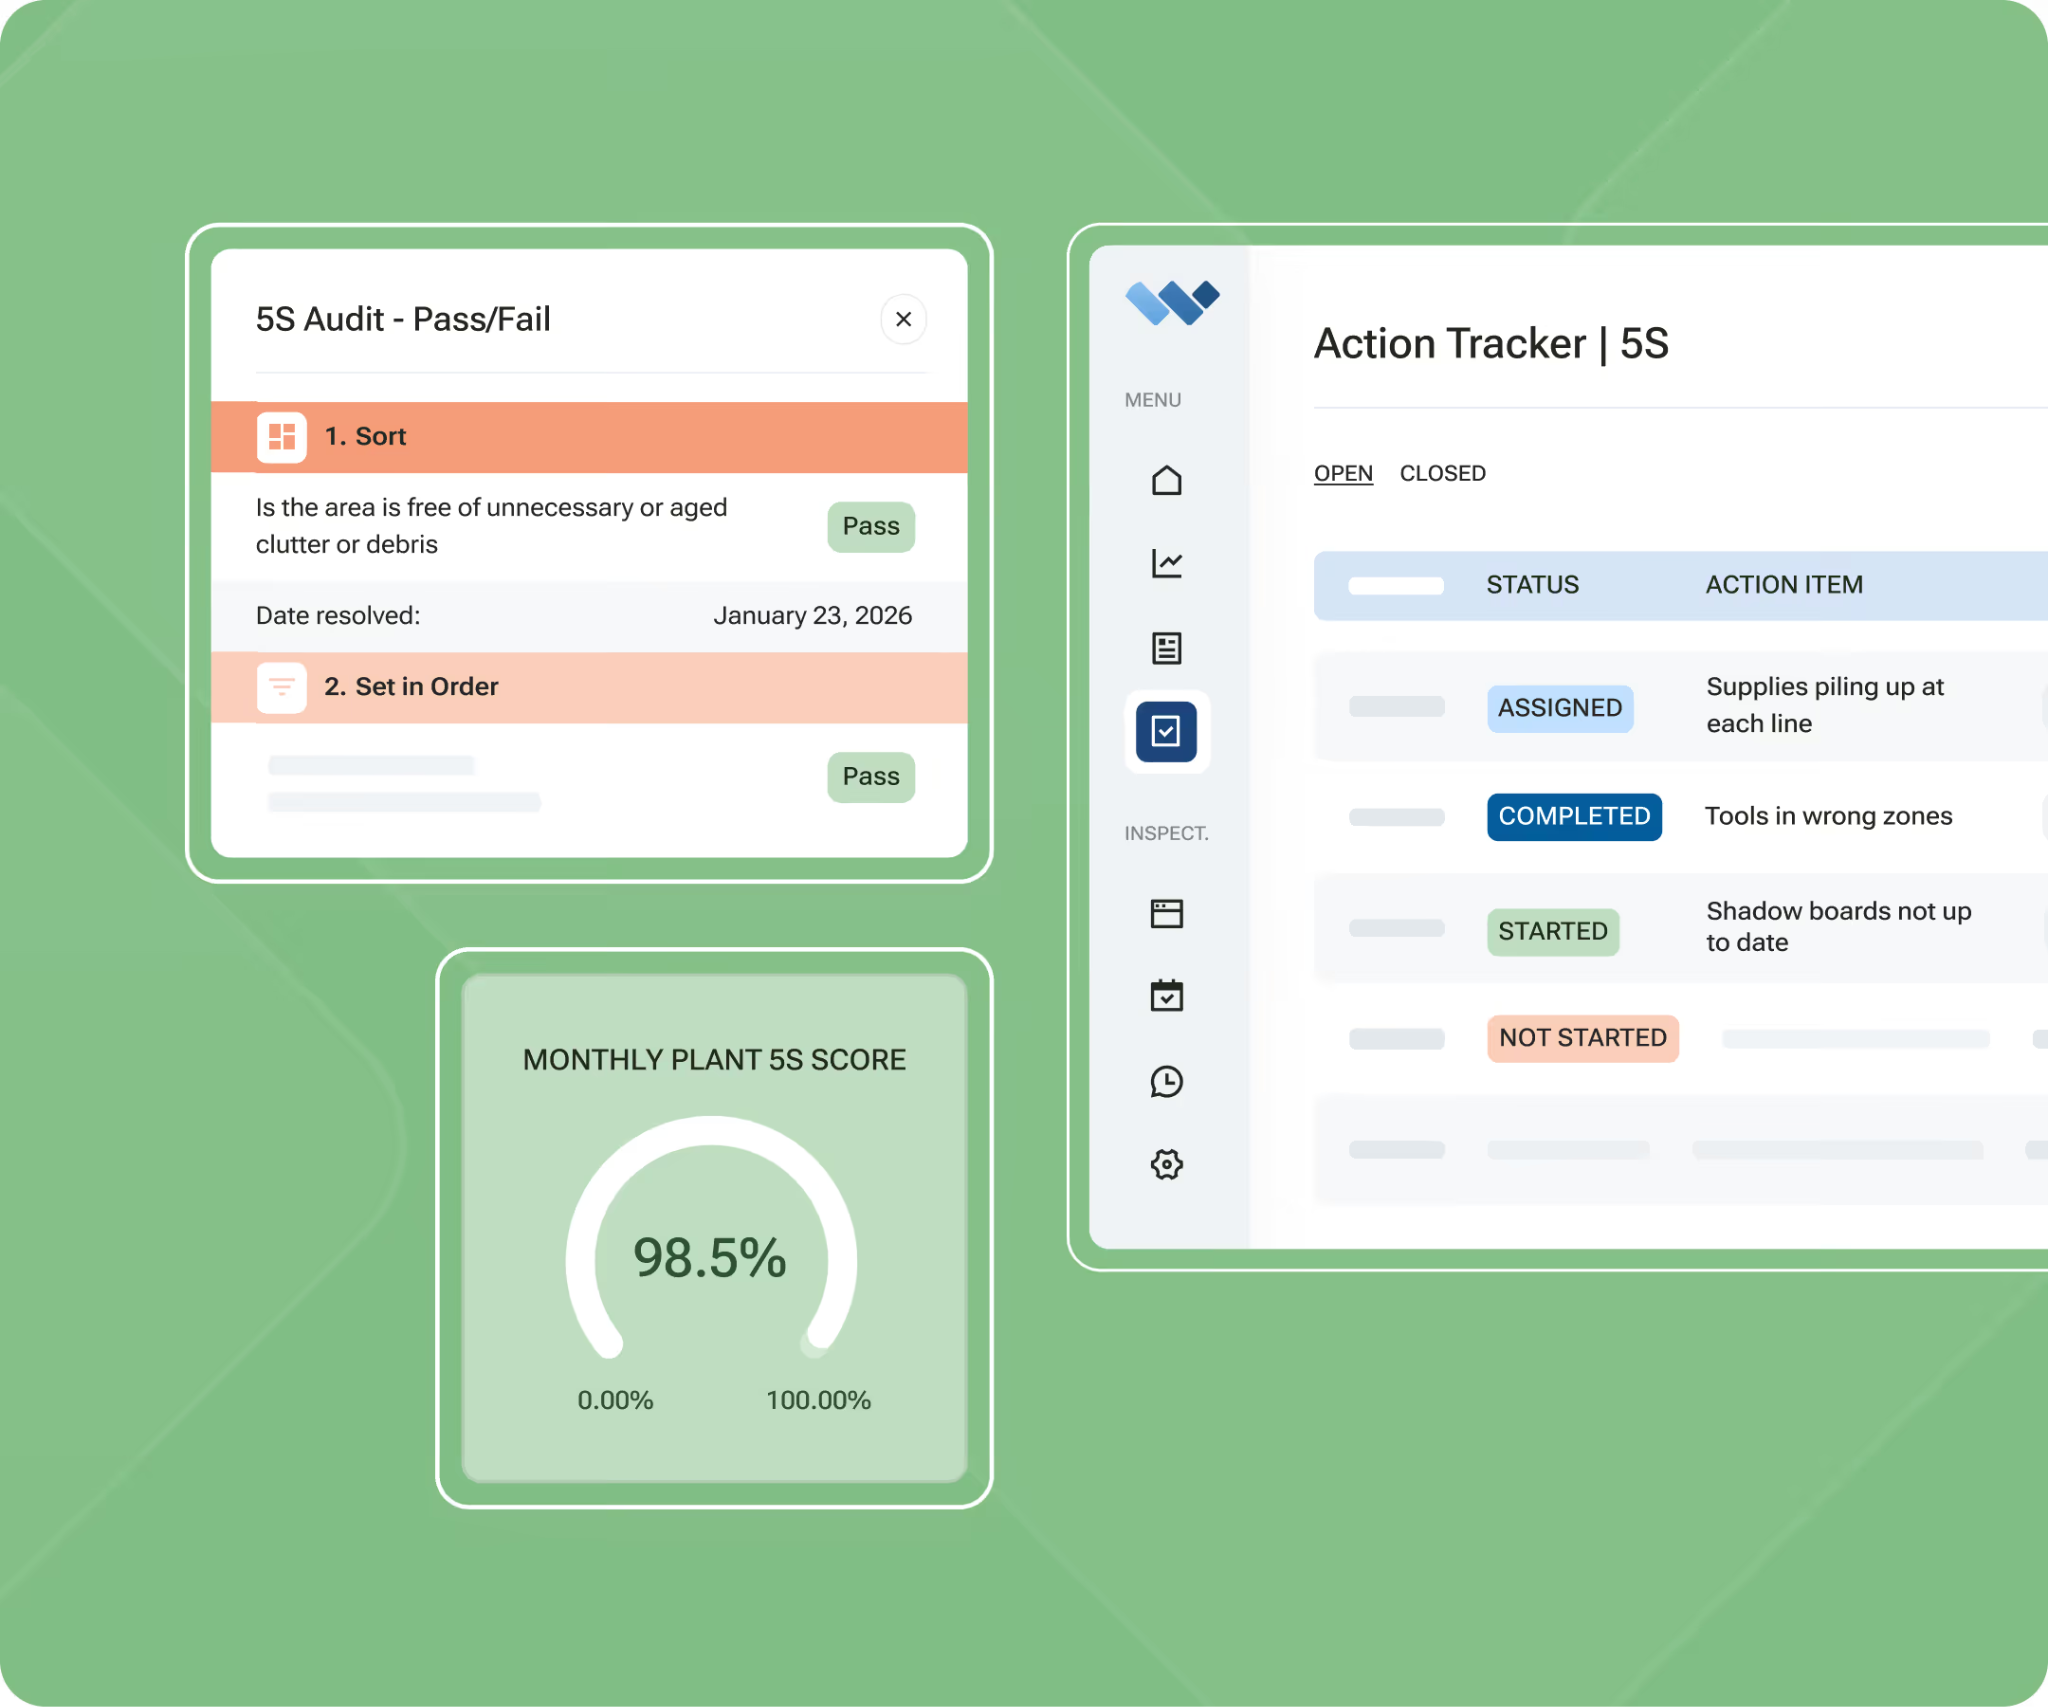
Weever is a connected frontline operations platform built for food and beverage, CPG, and other process manufacturers. It replaces paper audits, whiteboards, and scattered spreadsheets with a digital 5S process that is easier to run consistently.
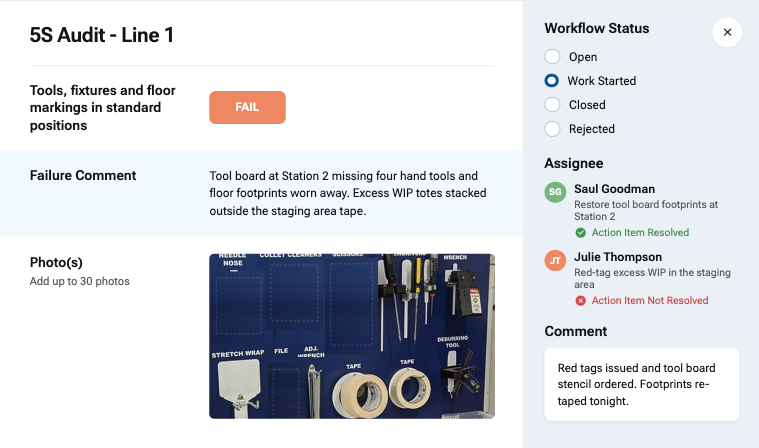
Auditors complete scheduled 5S inspections from a shared tablet, phone, or workstation device. They score Sort, Set in Order, Shine, Standardize, and Sustain against the plant’s own standards while adding photos, comments, signatures, and red tags directly to the checklist.
Instead of ending with a completed scorecard, Weever keeps every finding moving. If an auditor identifies an issue, it can be assigned to the responsible area owner with a due date and reminders. The record stays linked to the original audit until the corrective action is closed.
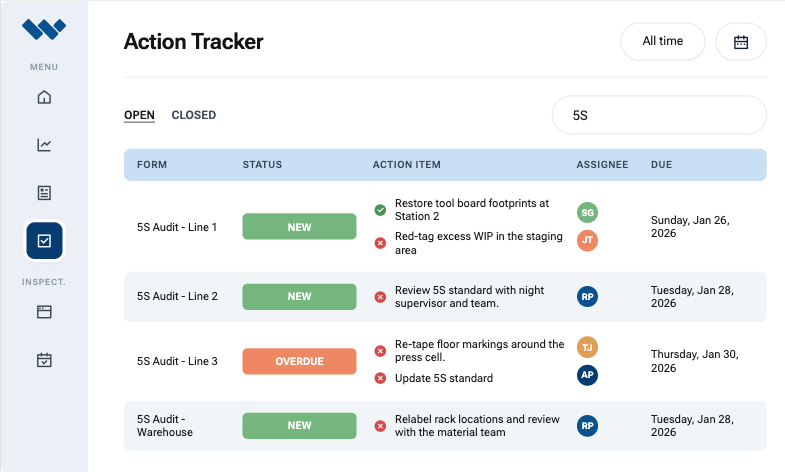
During a Sort audit, for instance, an operator may find obsolete material stored beside a production line. They photograph it, submit a red tag, and assign its removal before leaving the area. Supervisors can then see what was found, who owns the action, and whether it has been resolved.
As audits continue, Weever updates dashboards with scores, open actions, overdue items, recurring findings, and historical trends. Managers can compare performance by workstation, department, site, or region instead of piecing information together from spreadsheets and manual boards.
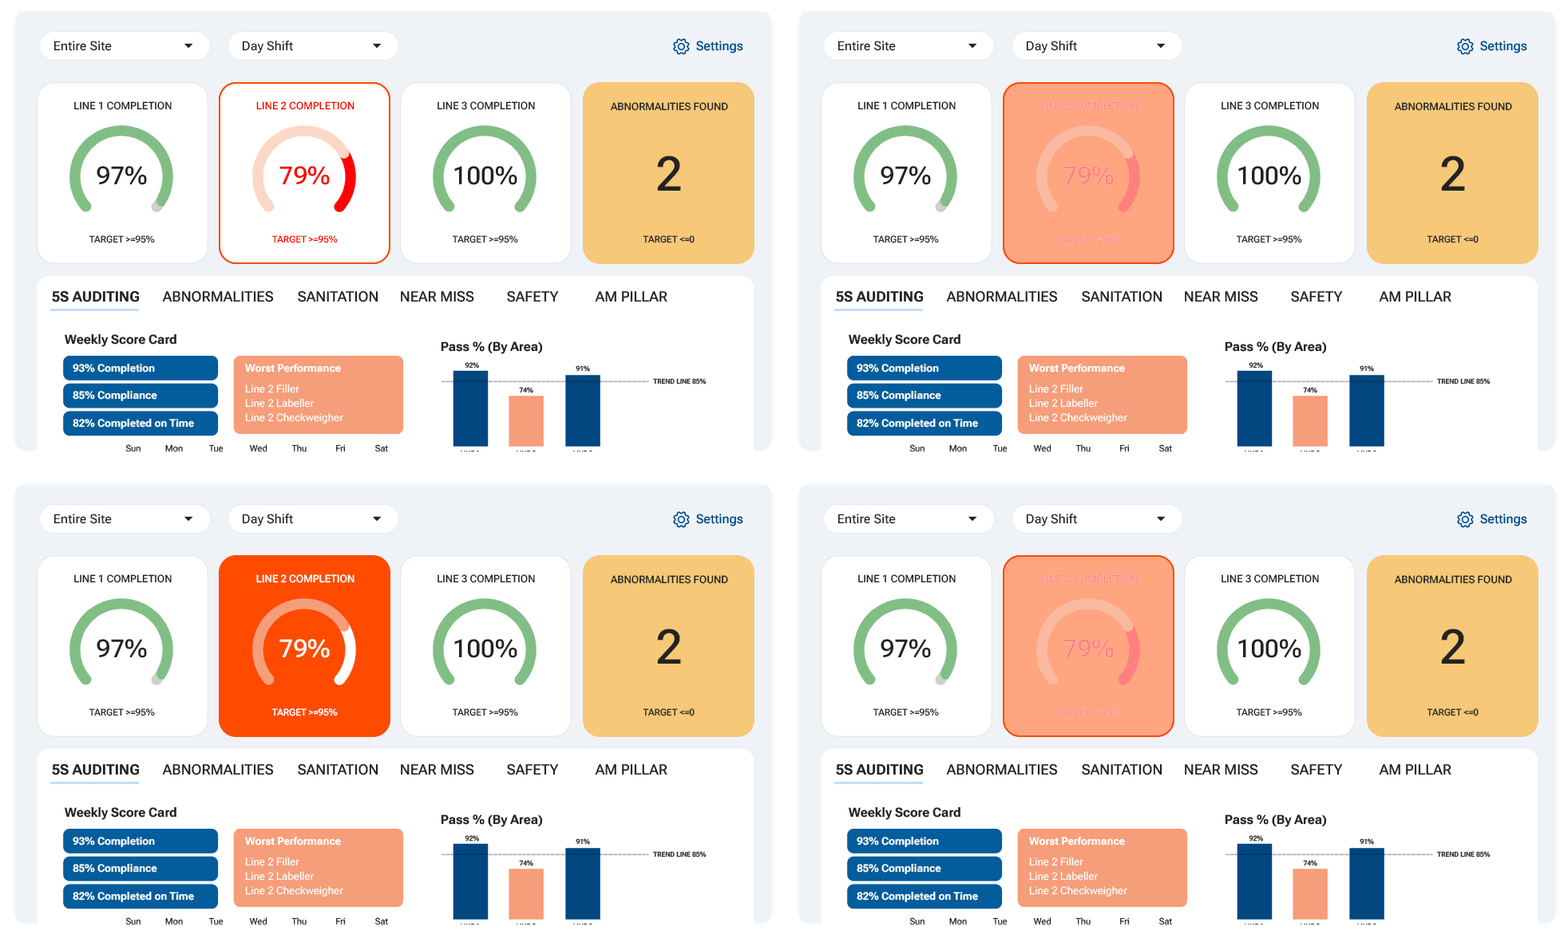
Plant managers can also use Weever Radar™, an optional AI layer, to catch early signs of decline between formal reviews. For example, if Shine scores keep dropping on one line or the same criterion fails repeatedly, Radar surfaces the pattern so supervisors can step in before it becomes routine.
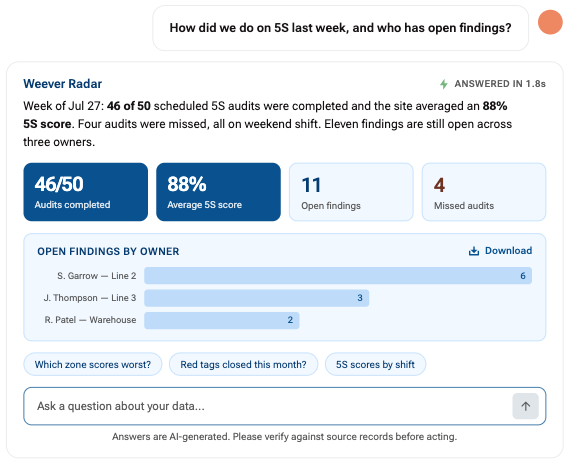
For multi-site operators, each facility can tailor scoring weights, evidence requirements, and approval steps to its own floor. Shared templates still keep the wider 5S program consistent across sites, without ignoring differences in equipment, layouts, or local risks.
Key Features
- Mobile 5S audit scorecards: Complete scheduled audits with photos, comments, signatures, and real-time scoring on a shared tablet or phone.
- Automatic action items: A failed item or red tag becomes an owned, due-dated action the moment it's logged.
- Digital red-tagging: Flag an item that doesn't belong, log it with a photo, and track it through to resolution.
- Multi-site 5S dashboards: Compare scores, open actions, and repeat issues across areas, plants, and corporate views.
- Weever Radar™: An optional AI layer that flags failing criteria and sliding scores between reviews, catching Sustain-phase drift early.
- Enterprise integrations: Connect audit and action data with ERP, CMMS, SAP, Microsoft Dynamics, Power BI, and SSO systems.
- QR-code audit access: Scan a code at the workstation or production area to open the correct audit instantly, no manual navigation.
- Weighted scoring: Score safety or quality failures higher than minor findings, so critical issues carry more weight in the final score.
- Multilingual audit forms: The same checklist adapts to the languages spoken across a plant's frontline crew.
Pros
- Scoring rules and forms can be set up to match each plant's own risk areas, without custom development
- Unlimited users per site mean the whole floor can take part, not just a few designated auditors
- Photos and timestamps attached to every finding create a defensible audit trail
- The same system can later run autonomous maintenance, safety, sanitation, and quality programs
Cons
- Overkill for teams that simply want a basic, checklist-only 5S app
Why we picked this
Configurability is what separates Weever from other 5S inspection software. Instead of forcing every facility into the same workflow, plants can tailor audits around their own standards, risk priorities, and approval processes.
The platform also supports immediate follow-up when a check fails. Conditional workflows, required fields, and automatic actions help standardize responses. The audit layout also follows the same flow as the paper process teams already know, so adoption is fast.
What Customers are saying
Weever's biggest selling point for 5S is closing the loop between a failed audit item and a fixed one, while keeping scores moving in the right direction. Adient's experience shows what that looks like on the floor:
"Issues are resolved, and quickly. 5S scores are increasing and sustained throughout, and the team is extremely happy with what we have achieved in a short space of time." - Tim Clansey, Training Manager and 5S Champion at Adient
Customers also highlight how accessible Weever is for frontline operators:
"Having cloud-based forms on devices around the facility makes them so much more accessible, which makes it painless for operators to quickly provide a report." - Johanna Velez, VP Quality Assurance at Monin
Ease of use is another strong point that customers often talk about:
"Weever is really user friendly and will have a massive positive impact on our operations and training team." - Mel Cadle, Op Ex Lead Process Engineer at HelloFresh
Pricing
Weever offers site-wide pricing with unlimited users, so operators, auditors, supervisors, managers, and plant leaders can all participate without seat count limiting access.
Book a demo to see how Weever runs 5S audits on your floor.
2. Ease.io - Best for automotive and aerospace manufacturing
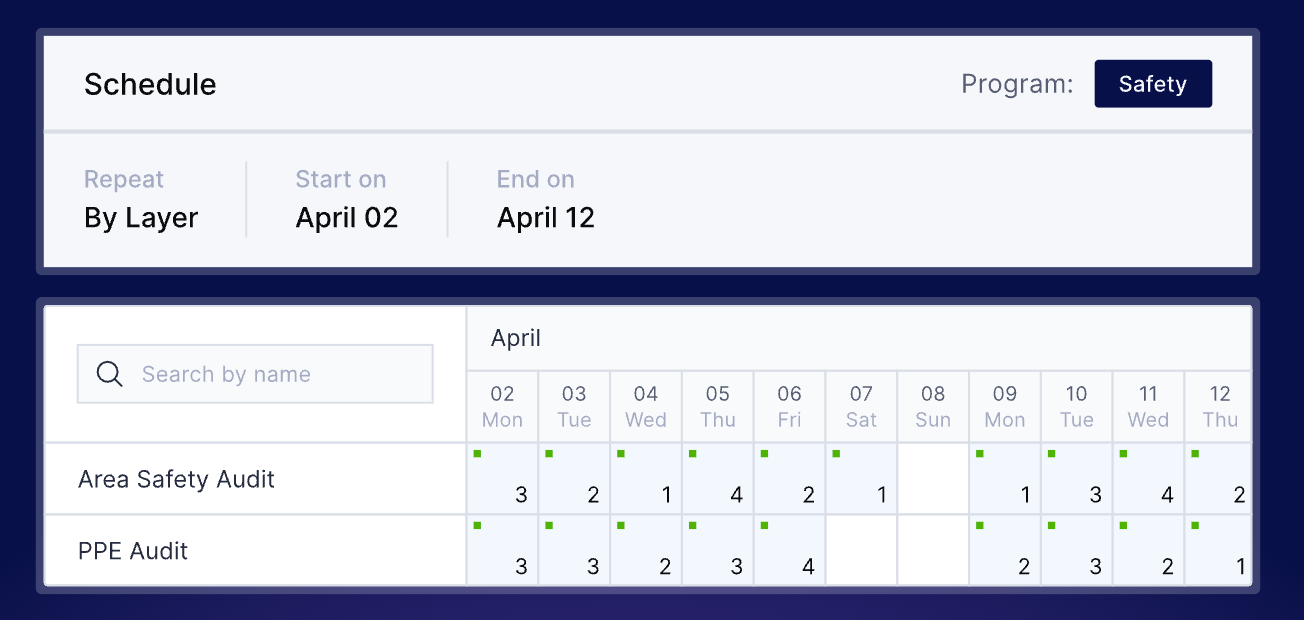
EASE.io is a manufacturing audit platform built around layered process audits, quality inspections, and compliance programs. Its clearest fit is automotive and aerospace plants working under standards such as IATF 16949 and AS9100D.
For 5S, EASE is most relevant when audits sit alongside wider quality requirements. Plants can rotate questions across frequent checks, apply automotive audit guidelines, and ensure only qualified employees are assigned to specific assessments.
Key features
- Auditor Qualifications: Attach competency requirements to an audit so only eligible employees can be scheduled.
- Question Randomization: Pull changing questions from a tagged library across recurring assessments.
- Industry Compliance Support: Run audits aligned with CQI-8, automotive customer-specific requirements, and AS9100D programs.
Pros
- Built specifically for manufacturing audit programs
- Strong automotive and aerospace compliance coverage
- Connects auditor training with assessment eligibility
Cons
- Report setup can take time when teams need highly specific views
- Most relevant when layered audits are already part of the operating system
Why we picked this
EASE.io earns its spot for how deeply it fits into automotive and aerospace compliance work, not as a general audit tool with those industries added on. Question rotation, auditor qualifications, and CQI-8 alignment are all built for plants already running layered process audits.
Pricing
EASE offers three plans:
- EASE: $720/site/month
- EASE Plus: $890/site/month
- EASE Pro: $1,290/site/month
3. SafetyCulture — Small plants running 5S audits, looking for high free-tier limits
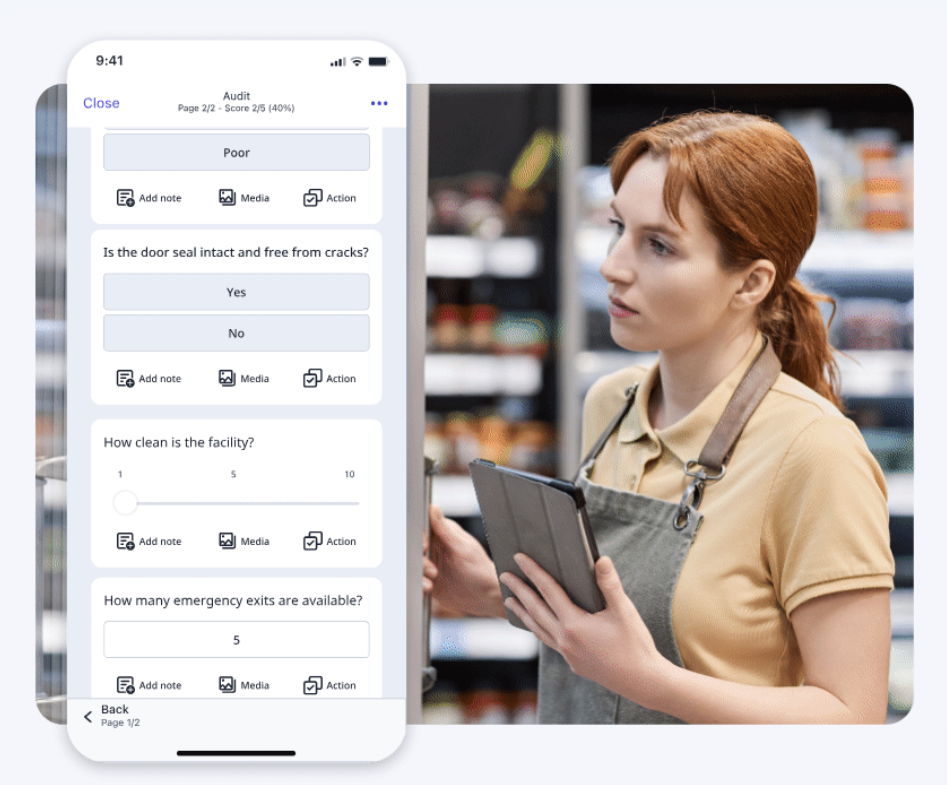
SafetyCulture is a general inspection platform with a Public Library that includes editable 5S, Gemba, GMP, and manufacturing audit templates. A plant can copy a checklist, replace irrelevant questions, add its own scoring, and issue the revised version without building the form from a blank screen.
It also converts existing XLSX, PDF, JPEG, and PNG files into editable templates. This is useful when a site has accumulated paper forms and Excel audits but does not want to recreate every question manually.
Key features
- Public Template Marketplace: Browse and customize thousands of templates created by SafetyCulture and its community.
- AI Checklist Creation: Generate editable checklists from prompts, photos, PDFs, Excel files, or existing documents.
- Offline Mobile Inspections: Complete inspections without internet access and sync the data once the device reconnects.
Pros
- Makes it easy to digitize existing PDFs, spreadsheets, and paper forms
- Offers ready-made templates across many industries, not only manufacturing
- Supports offline work in facilities with unreliable connectivity
Cons
- Report customization can feel limited
- Automation and integrations may be complex to configure
Why we picked this
SafetyCulture was included for its public template library, AI-assisted checklist creation, and offline inspection support. These features make it suitable for teams managing several inspection types across different departments.
Pricing
- Free: Up to 10 users and five active inspection templates
- Premium: $24 per user/month annually or $29 monthly
- Enterprise: Custom pricing
4. Lumiform - Best for digitizing existing inspection forms
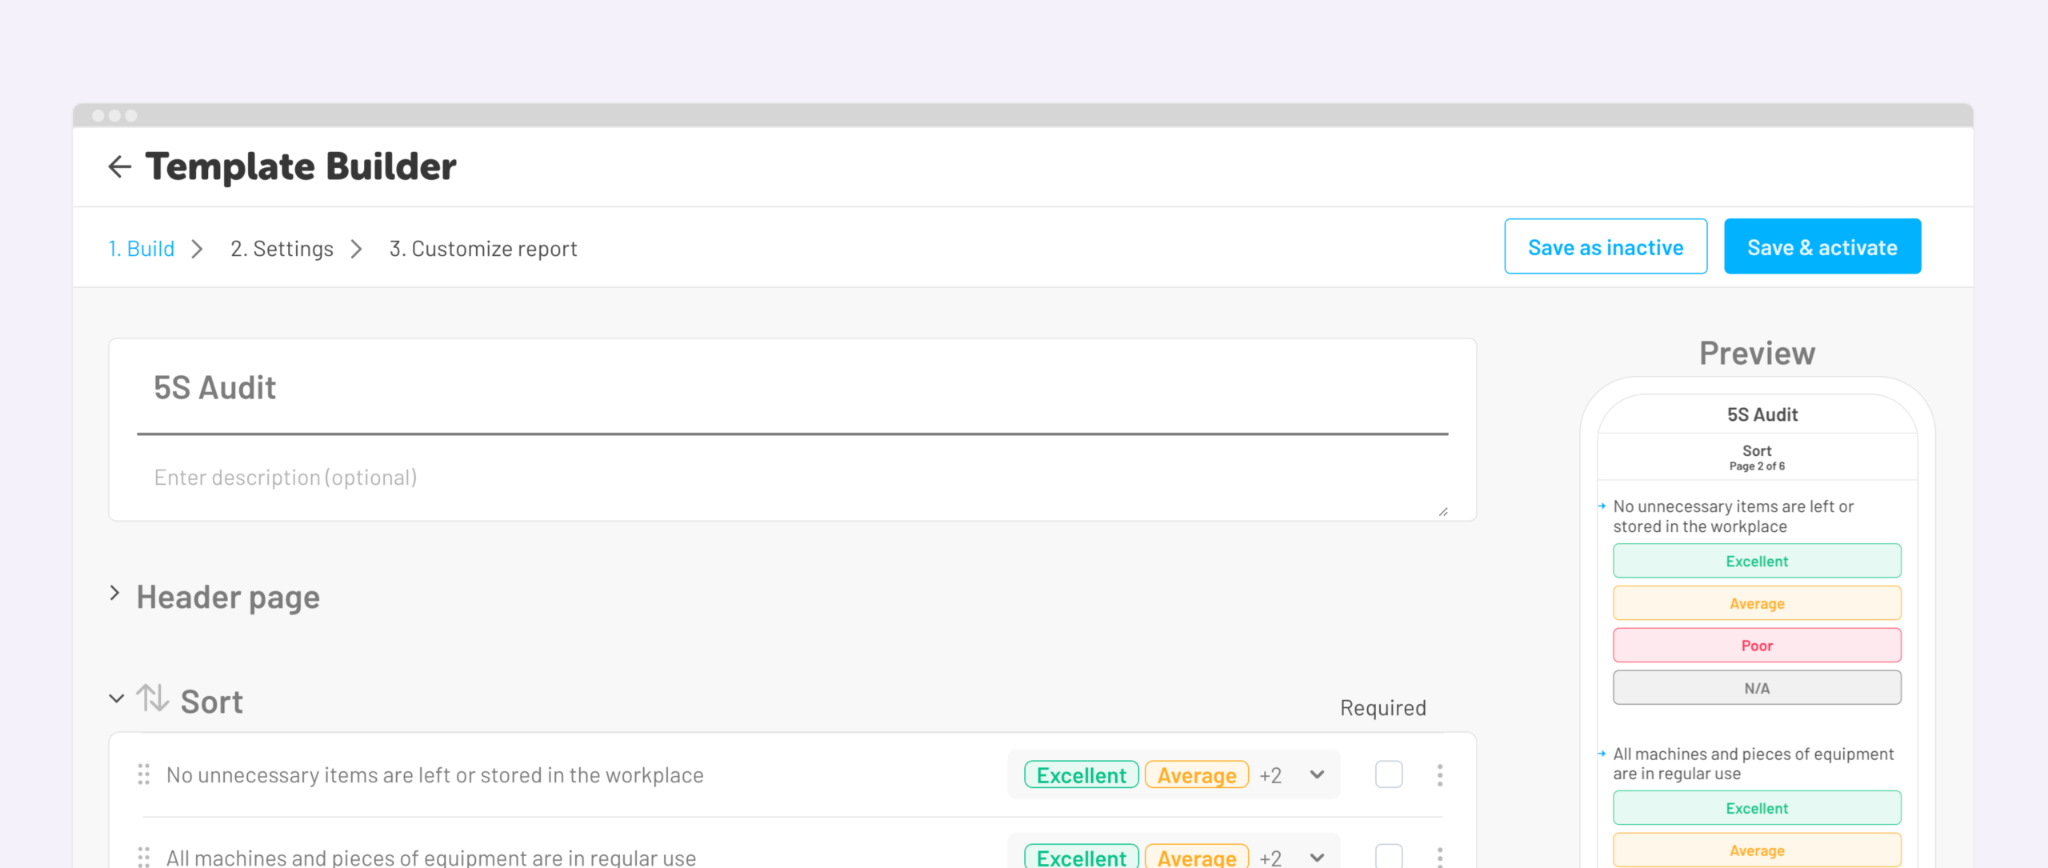
Lumiform is a mobile inspection platform that helps teams move existing paper and spreadsheet-based audits into a digital format. Users can upload PDF, Word, Excel, or image files, generate forms with AI, or start from a library of more than 12,000 templates.
For 5S teams, it helps reduce the work involved in recreating existing checklists. Imported forms can then be reviewed and prepared for mobile use rather than rebuilt manually from a blank page.
Key Features
- AI Form Translations: Converts one master audit into more than 60 languages based on the user’s device setting.
- AI Form Creation: Converts PDF, Word, or Excel documents into templates or creates a form from a written prompt.
- AI Photo Validation: Checks submitted photos against configured standards and returns immediate compliance feedback.
Pros
- Offers several ways to create digital inspection forms
- Large template library provides a quick starting point
- Structured Excel imports give teams control over form layout
Cons
- 5S is one use case within a broader inspection platform
- Imported forms still require review before fields, logic, and workflows are ready for use
Why we picked this
Lumiform earns a place because it reduces the setup work involved in moving existing inspections online. Teams can begin with their current documents, an AI-generated form, or a ready-made template instead of starting every 5S checklist from scratch.
Pricing
Starts at $112 per month. However, both Professional and Enterprise plans require a vendor quote.
5. GoAudits - Best for replacing paper inspections
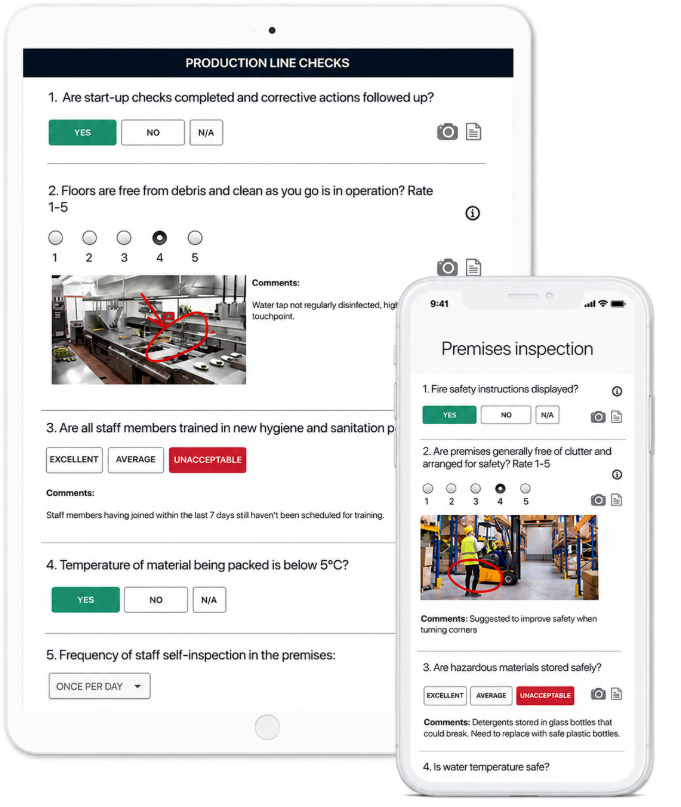
GoAudits is a customizable digital inspection and auditing platform that helps replace paper forms and manually prepared audit records.
The platform stands out for its reporting flexibility. Reports can be customized with branded layouts and cover pages, exported to Word or Excel, and automatically shared with selected recipients. GoAudits also offers free checklist setup by converting existing forms into digital checklists.
Key features
- Branded Report Templates: Customize inspection reports with company logos, colors, layouts, and professionally designed cover pages.
- Word and Excel Exports: Download completed inspection reports in editable Word or Excel formats for further analysis or external sharing.
- Free Checklist Conversion: GoAudits’ team can convert existing paper forms and checklists into digital templates at no additional cost.
Pros
- Voice-to-text and speech-to-text notes
- Permissions, user roles, and organizational hierarchies
- Photo capture for individual audit questions
Cons
- Confusing permissions and hierarchies
- No XLSX upload support
Pricing
- Starter: $10/user/month
- Enterprise: $30/user/month
6. Tulip - Best for plants already using Tulip for other shop-floor apps
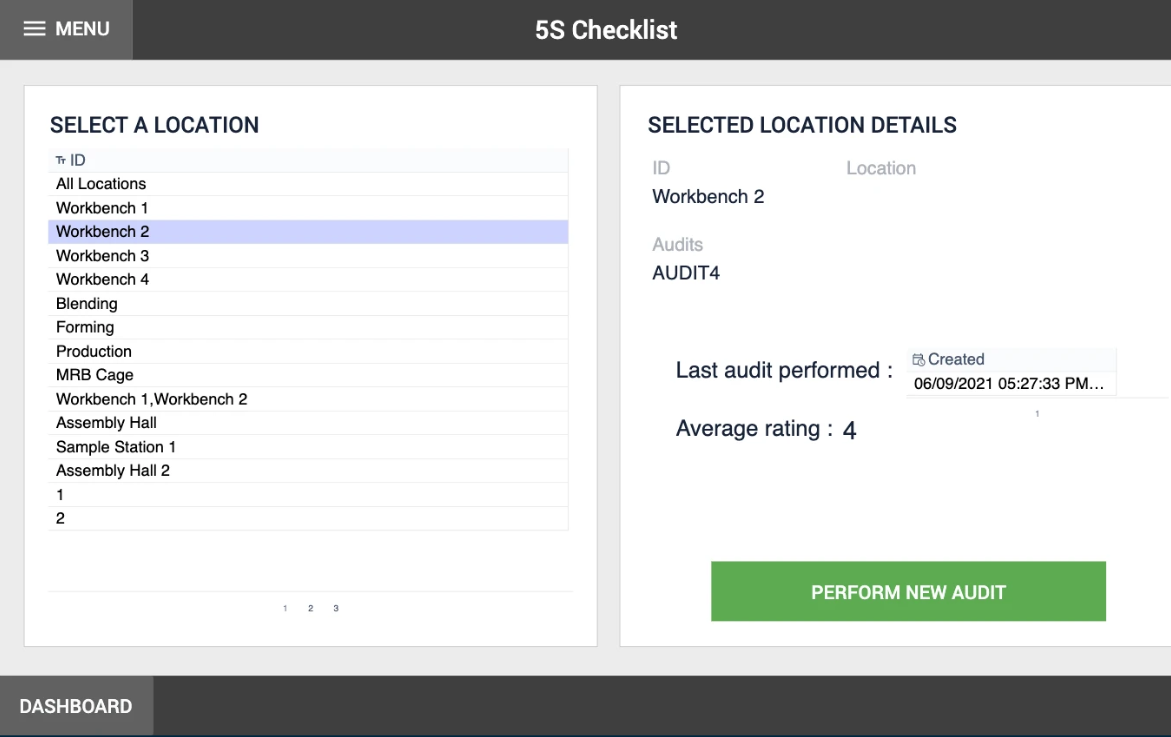
Tulip is a composable operations platform rather than conventional 5S audit checklist software. Its library includes a dedicated 5S Checklist app with 25 checks covering the five audit categories, automatic result storage, and an included dashboard.
Its main appeal for 5S specifically is convenience for teams already standardized on Tulip for other shop-floor apps. Tulip's audit tooling is built to pair 5S scores with machine, sensor, or production data in the same dashboard, for plants that want 5S context next to equipment performance rather than in a separate report.
Key features
- 5S Radar Chart Widget: Compares one audit or aggregated results against a defined target score.
- Prebuilt 5S Checklist app: 25 checks covering all five audit categories, with automatic result storage.
- Edge IO and Edge MC: Connect Tulip applications to industrial equipment, sensors, and peripheral devices.
Pros
- Quick deployment
- Supervisors get an at-a-glance read on how a site is tracking against target, without building a separate report
- A natural fit for plants already running other Tulip apps
Cons
- Users note a learning curve for anything beyond the prebuilt template, since deeper customization uses the same builder as Tulip's broader platform
- Tulip Tables are less suited to large or complex datasets
Why we picked this
Tulip was included for teams that already run other shop-floor apps on Tulip and want their 5S checklist on the same platform, rather than for 5S-specific capability on its own.
Pricing
- Essentials: Starts at $100 per interface per month
- Enterprise: Custom pricing
7. Alpha TransForm - Best for building custom mobile field apps
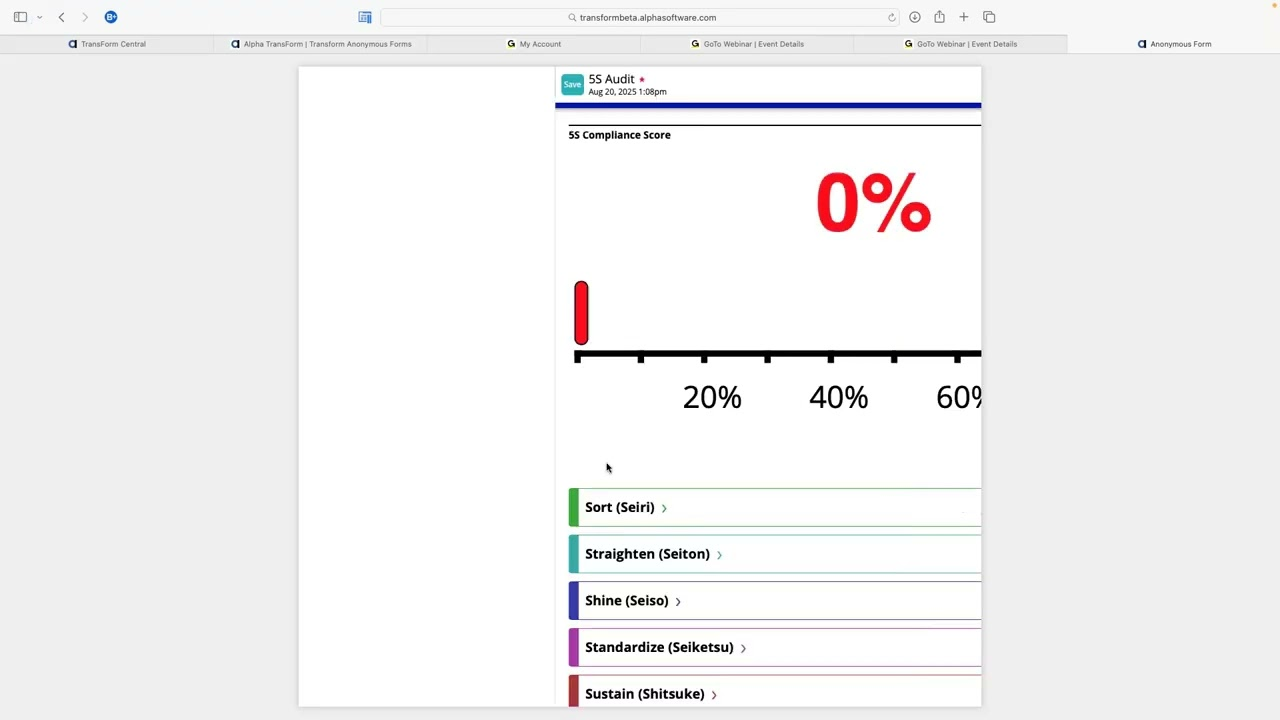
Alpha TransForm is a no-code platform for building custom mobile and web applications around field data collection. Teams can create forms, add business logic, signatures, GPS details, and barcode scans, then connect that data to back-office systems.
Its main value is flexibility at the app level. Rather than starting from a fixed 5S product, teams build the application structure, screens, rules, and data flows around their own process.
Key Features
- No-code form builder: Build and deploy a custom inspection form without developer resources.
- Offline data collection: Complete forms without a connection; data syncs once the device reconnects.
- GPS location tagging: Automatically attach a location stamp to a submitted form, useful for confirming an inspection happened at the right place.
Pros
- Supports highly tailored mobile app experiences
- Handles several field data types in one application
- Works across mobile and web environments
Cons
- Barcode values must be entered manually in the browser version
- Web Filler GPS can be less precise for field records than native mobile GPS
Why we picked this
Alpha TransForm is a strong fit for teams that want to get any paper form, 5S included, into digital use quickly, without waiting on a longer implementation process.
Pricing
Alpha TransForm offers a free tier for up to three users. Its Business plan costs $30 per user per month, with volume pricing available for larger deployments.
8. Inspectly360 - Best for AI-assisted visual inspections
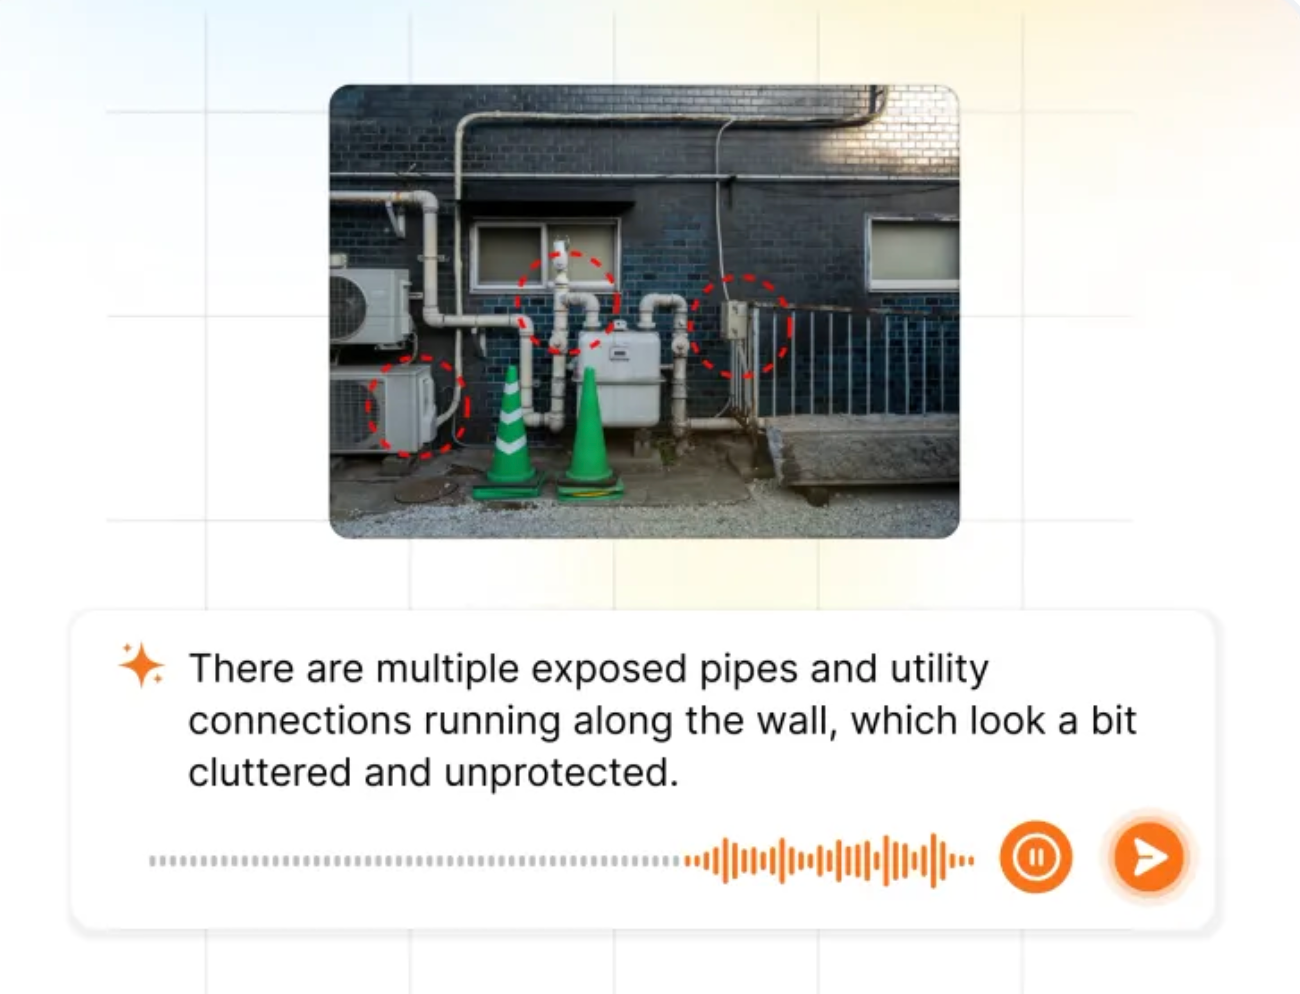
Inspectly360 is an inspection platform that uses on-device AI to review photos captured during audits. The system can flag cracks, corrosion, missing PPE, blocked exits, and other visible issues, then suggest the category, severity, and relevant form fields for the inspector to confirm.
For 5S audits, its clearest distinction is reducing manual entry. Inspectors can photograph a finding or speak an observation, while AI helps document the issue and prepare the inspection record.
Key features
- AI-Generated daily briefings: The platform can summarize overdue inspections, problem sites, and areas that need attention. Managers can also use natural-language queries for inspection data.
- Recurring-issue detection: A finding repeating across multiple audits within a set window can be flagged and converted into a kaizen item automatically.
- Role-based audit cadences: Set different audit frequencies for operators, supervisors, and managers, in line with layered process audit structures.
Pros
- AI runs on the device without requiring an internet connection
- Photo-to-form suggestions reduce manual data entry
- Supports hands-free observation capture through voice input
Cons
- AI findings still require confirmation from the inspector
- Limited language support for voice transcription
Why we picked this
Inspectly360's AI layer is a genuinely different approach to catching issues during a 5S audit, applying automated photo analysis on top of the standard scorecard rather than relying solely on the auditor.
Pricing
Offers two pricing tiers: Growth and Enterprise, with a custom quote based on team size, usage, and required features.
9. Tervene - Best for lean daily management
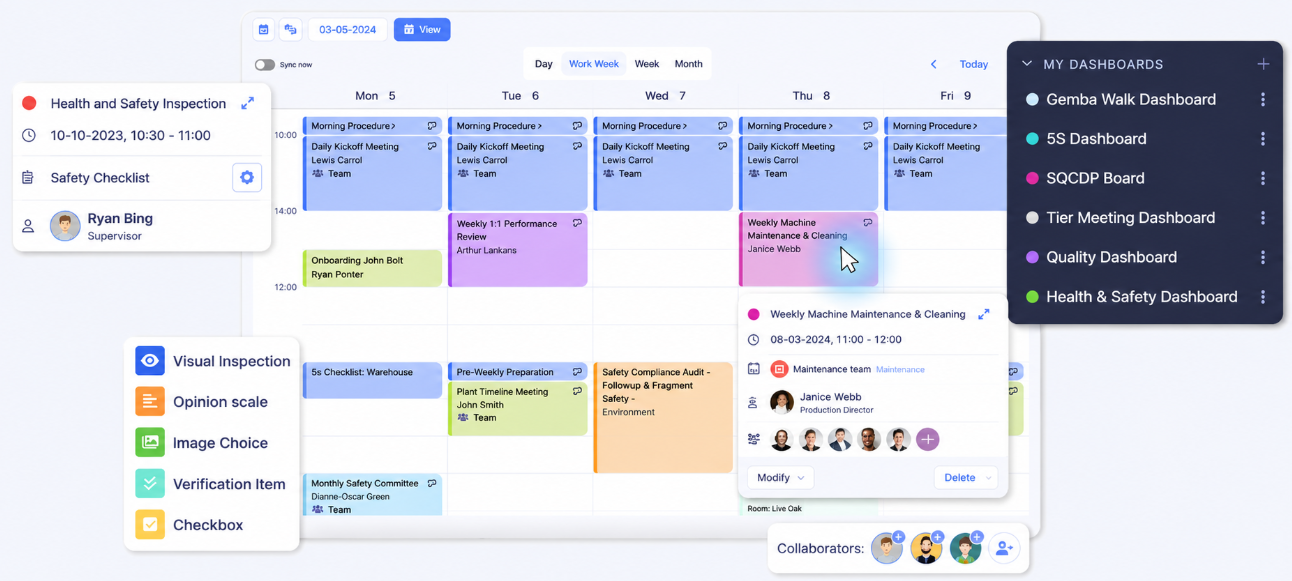
Tervene is a connected-leader platform for manufacturing and industrial teams. It is built around Leader Standard Work, helping supervisors and managers organize recurring routines, management reviews, floor walks, and follow-up activities in one system.
It also supports tiered meetings across management levels. Teams can review performance, escalate issues, and keep daily leadership activities aligned.
Key features
- Layer-Specific Scheduling: Set different audit frequencies for operators, supervisors, managers, and plant leaders.
- Adaptive Audit Scheduling: Manage 10 to 200 weekly audits across shifts and work calendars, with schedules updating for leave, new users, and checklist changes.
- Two-Level Escalation: Escalate overdue audits or actions from the responsible supervisor to the next management level.
Pros
- Scheduling for appointments and recurring activities
- Daily recordings compared against targets
- Real-time process and workflow tracking
Cons
- Performance can slow when handling large datasets or complex projects
- Weak Office 365 compatibility
Why we picked this
Tervene made the list for its emphasis on daily management practices such as leader routines, tiered meetings, and shift handovers, with 5S and safety audits built in as part of that structure.
Pricing
Custom quote
10. Quentic - Best for EHS and certification audits
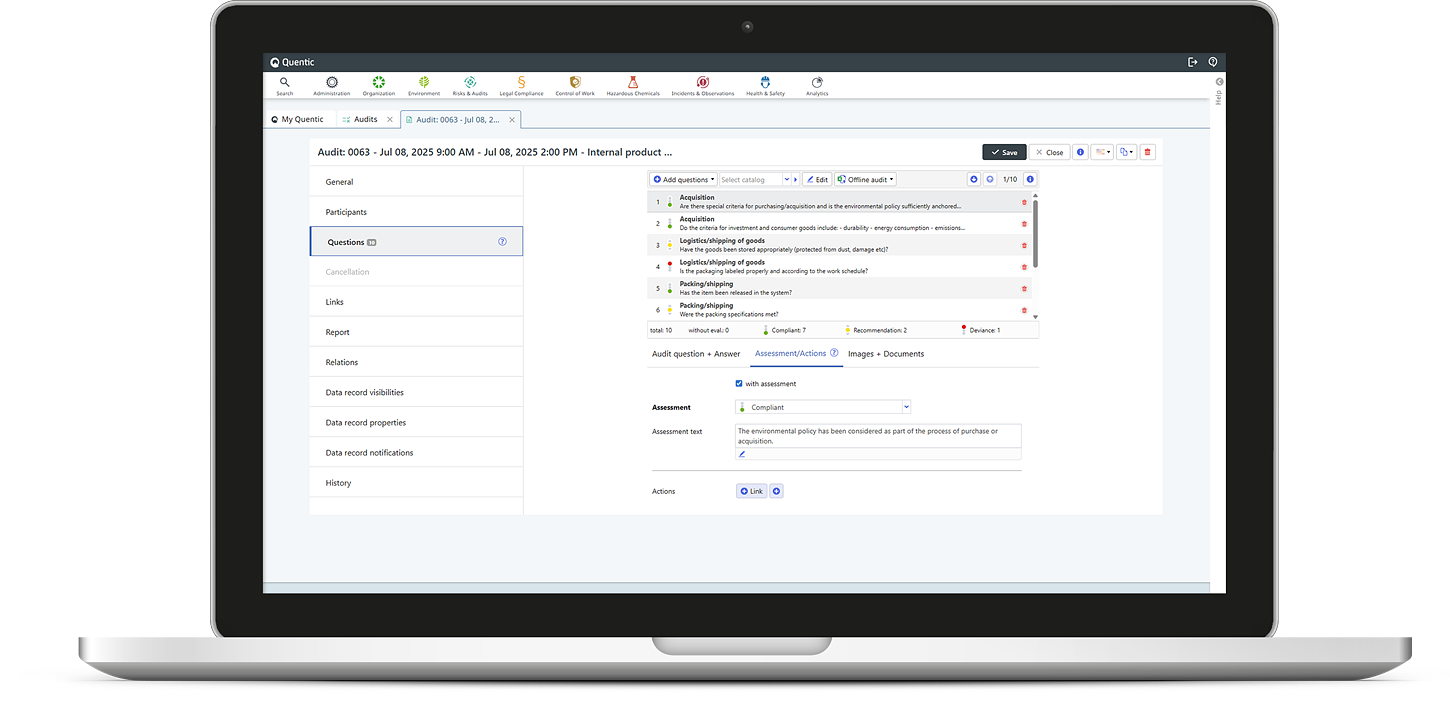
Quentic is an EHS and ESG management platform with a dedicated Risks & Audits module. It’s designed for internal and external audits tied to standards such as ISO 9001, ISO 14001, ISO 45001, and ISO 50001.
For manufacturers, 5S can sit within a wider audit and certification program. Teams can plan audit calendars, involve internal or external participants, use predefined question catalogues, and generate formal reports after each assessment.
Key features
- Modular EHS platform: Select and combine modules for audits, risk assessments, incidents, chemical management, and legal compliance as needed.
- Multi-country compliance tracking: Manage audit and certification processes across sites and countries under a shared framework.
- External auditor directory: Filter a database of external auditors to find specialists for areas such as energy, environmental, or management-system audits.
Pros
- Supports several major ISO management-system standards
- Coordinates internal teams and external auditors
- Generates standardized certification-ready reports
Cons
- 5S is one possible audit use case rather than a dedicated program
- The broader EHS and ESG scope may exceed the needs of a basic 5S team
Why we picked this
Quentic's depth on multi-country ISO certification and EHS compliance makes it a fit for enterprises where 5S is one part of a much larger regulatory and sustainability program, not a standalone need.
Pricing
Available upon request
Free trial
No self-service trial is publicly listed. A personalized demo is available.
How to choose 5S audit checklist software for your manufacturing plant
Don't choose 5S audit software by counting features on a pricing page. A successful 5S audit depends on what happens after the checklist closes, so start with the points where your current program actually breaks down:
1. Check if findings stay open
A completed audit has limited value when failed items get copied into an email, added to a manual board, or mentioned at the next shift meeting and then forgotten. During a demo, record a blocked walkway and check whether the system can assign an owner, set a due date, collect completion evidence, and show the action as open, overdue, resolved, or verified.
2. Test access on the floor
Personal logins and limited licenses cut down who can actually use the tool. Test it on a shared tablet and confirm a QR code opens the correct audit without digging through a form library.
3. Score against clear criteria
Inconsistent scores usually come from vague criteria, not bad math. One auditor passes a partly organized shadow board; another fails it because two tools are outside their marked spots. Look for configurable scorecards, weighted scoring, and required fields that make the standard explicit instead of left to judgment.
4. Look past the average score
A plant can hold a respectable score while the same oil leak sits open for months. Ask for dashboards that separate completion rate, failed criteria, recurring findings, open actions, overdue work, and time to closure, not just one number.
5. Require controlled standardization across sites
Cross-site reporting is misleading when one plant uses weighted questions, another uses simple pass/fail, and a third quietly dropped its hardest criteria. The scores look comparable, but they're measuring different things.
6. Check the actual data handoff
Don't accept "Power BI or CMMS integration" as a line item without seeing it work. Pick a real example, an oil leak, a missing label, and confirm which system receives the record, which fields transfer, and where closure gets tracked.
Make your 5S audit program easier to sustain
Sustain is the hardest S, and it is the one most tools quietly ignore. Sort, Set in Order, Shine, and Standardize get a work area organized. Keeping it that way, audit after audit, is a different problem, and it is usually where a strong 5S launch starts to slip.
This is where Weever and its Radar™ feature add a layer most audit tools don't: it watches for a score sliding between reviews or the same criterion failing repeatedly, and surfaces it before it becomes the new normal instead of after.
Book a demo to see how Weever helps plants sustain 5S between audits, shifts, and sites.
Frequently Asked Questions (FAQ)
1. What's the difference between a 5S audit and a layered process audit (LPA)?
A 5S audit scores workplace organization specifically, Sort, Set in Order, Shine, Standardize, and Sustain. An LPA is broader, checking multiple process and quality standards at different organizational levels, on a set frequency required by standards like CQI-8.
2. Does it work offline on the shop floor?
Some platforms support offline audit completion with automatic sync once the device reconnects, which matters most in facilities with weak or inconsistent Wi-Fi. Weever's 5S audits work this way: an auditor can complete a scheduled walk without a signal, and the record syncs the moment the device reconnects.
3. Can 5S audit software replace a physical 5S board?
For most plants, yes. A digital dashboard shows the same scores and open items a physical board would, updated automatically instead of by hand, and visible to more than one person at a time.
4. Does 5S scoring need to be weighted?
Not always, but it helps. Weighted scoring means a safety or quality failure counts more than a minor organizational issue, so the final score better reflects actual risk.

8 Best Connected Worker Platforms for Manufacturing in 2026 [Reviewed & Compared]
Quick summary
A Connected Worker Platform digitizes the checks, forms, training, and data your frontline captures every shift. Weever is the best connected worker software for multi-site process manufacturing plants that want to run inspections, safety, sanitation, quality, and autonomous maintenance programs on one platform. Every operator gets access, and there's no per-seat cost. SafetyCulture is built for smaller teams or single sites. It uses per-seat pricing and runs inspections across manufacturing and other industries. Meanwhile, Poka is a good fit for plants where operator training is the main issue.
Here are our top 3 picks:
What Manufacturing Plants Are Losing on the Floor
According to a Manufacturing Leadership Council survey, 70% of manufacturers still enter their data manually. Another 68% still rely on spreadsheets to analyze it.
If you run a plant, none of this is news. Your team fills out paper checks, and someone re-keys them into Excel a shift later. By the time anyone reviews the numbers, whatever the data was warning about has usually already happened. A Connected Worker Platform for manufacturing is built to close that gap.
Paperwork isn't the only thing plants lose this way, though. Experienced operators retire and take undocumented know-how with them, while machines keep generating data that never reaches the people who could act on it. The Connected Worker Platform category covers all three: frontline data, operator knowledge, and machine data. Most tools are strong in one or two, not all three, which is why picking the right one matters. In this blog, we'll compare the 8 best Connected Worker Platforms for manufacturing plants.
Why listen to us
We've rolled Weever out across safety, sanitation, quality, and maintenance programs. That spans single-site F&B operations and multi-site global CPG manufacturers alike. And it's given us a close look at what makes a program stick, and what makes teams quietly stop using a tool after the pilot.

The results follow a pattern. Royal Canin went from 300+ unresolved abnormalities to a 95% close rate and 6,000+ monthly submissions in under a year. Monin cut 3-4 hours a day off data entry and reporting. Mars Fort Smith hit an 89% resolution rate after replacing paper calendars and scattered SharePoint folders. Different plants, different starting problems, same outcome once the data had somewhere to go.
What is a Connected Worker Platform for manufacturing?
Weever is a connected worker platform for food manufacturers, CPG, pharma, and other process manufacturing plants. It runs structured floor programs for safety, sanitation, quality, and maintenance on a single system instead of scattered spreadsheets and paper.
Connected is the operative word here, and it covers four specific relationships:
- Connected to each other: Operators, supervisors, and managers share the same real-time view of a task or defect. Nobody finds out about it a shift later.
- Connected to the equipment: A defect logged by an operator lines up with the asset's maintenance history or a SAP work order. It doesn't sit as a disconnected note in a separate system.
- Connected to the systems that already run the plant: ERP, MES, and CMMS systems already hold plant data. A Connected Worker Platform doesn't replace them - it feeds them the frontline context they can't capture on their own.
- Connected across time: New hires and experienced operators aren't working off the same knowledge. A connected worker platform captures what an experienced worker knows, through training content, SOPs, or a skills matrix, so it doesn't leave when they do.
Underneath Connected Worker software for manufacturing are a few core building blocks: digital data capture, action tracking, knowledge management, and reporting. No single platform, including Weever, does all of these jobs equally well. That's the whole point of creating this comparison listicle.
What does a Connected Worker Platform include?
A Connected Worker Platform can include a wide range of capabilities. No platform covers all of them:
- Digital forms and checklists with conditional logic and mandatory fields
- E-signatures and timestamped audit trails
- Photo, video, and sketch capture, plus red-tagging for defective equipment
- Multilingual forms and shift handover logs
- Corrective action workflows with owners, due dates, and closure tracking
- Real-time dashboards with roll-ups by line, shift, area, and site
- Multi-site management with central templates and site-level configuration
- Integrations into ERP, MES, CMMS, SAP, and Microsoft Dynamics, or direct machine and PLC connectivity for real-time equipment data
- Digital work instructions, SOPs, and peer-to-peer knowledge capture
- A skills matrix to track who's trained on what
- AI features like predictive insights or a chat assistant
- Regulatory support for standards like FDA, HACCP, SQF, 21 CFR Part 11, or AS9100
Most platforms specialize in one or the other. That’s exactly why the right fit for your company totally depends on the programs you typically run.
8 best Connected Worker Platforms for manufacturing in 2026
Before getting into the details of each platform, here’s a table that will give you a side-by-side look at all eight tools.
1. Weever
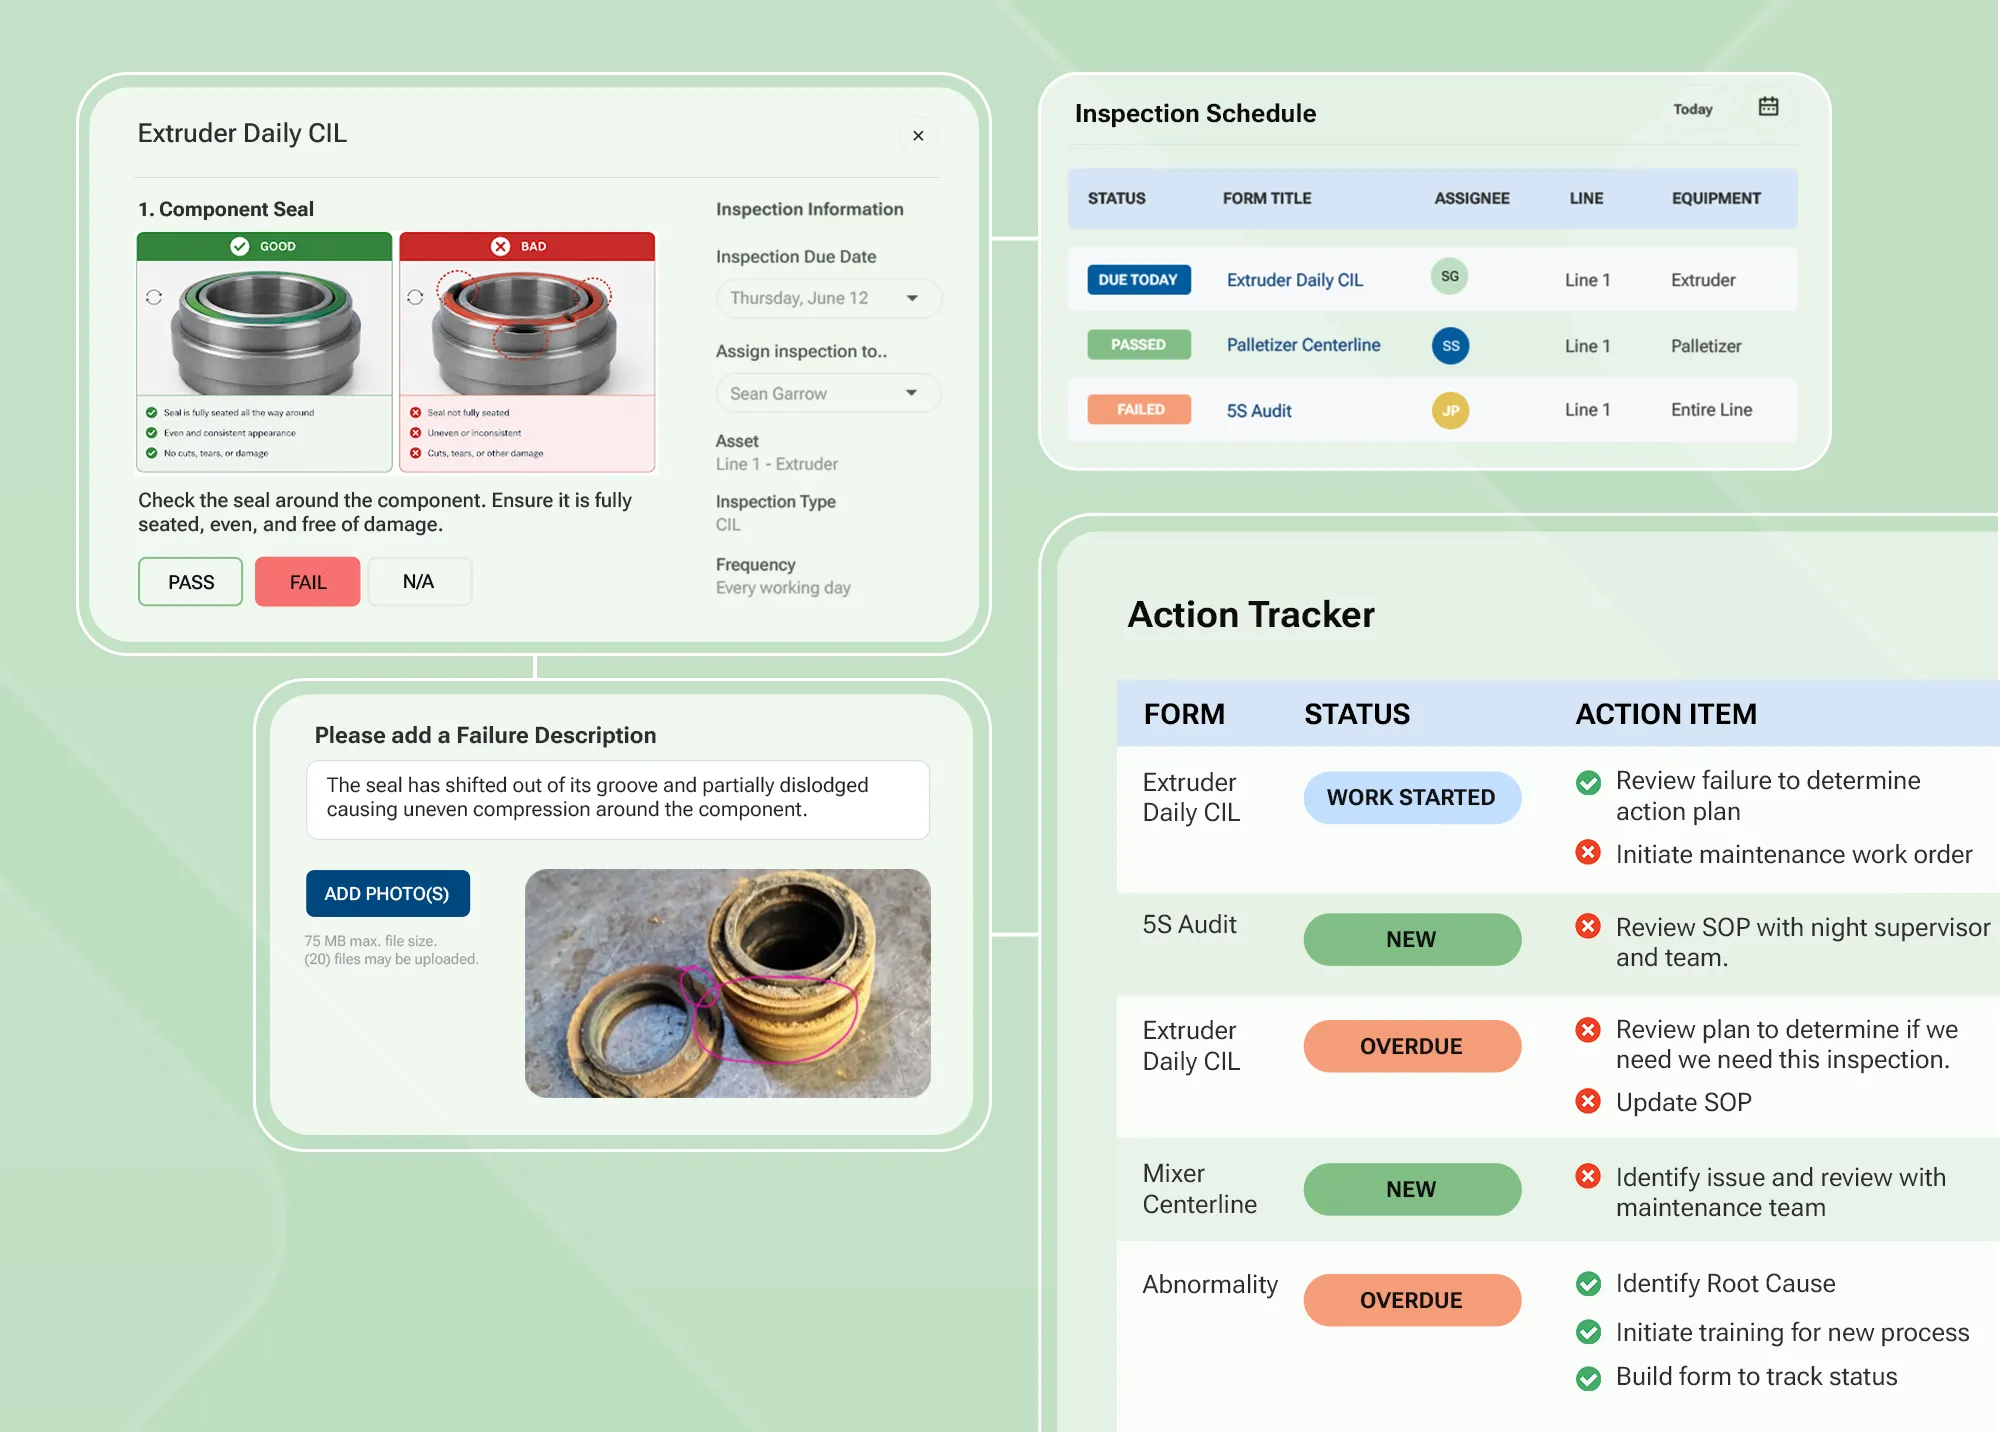
Weever is a Connected Worker Platform that runs structured floor programs for safety, sanitation, quality, and maintenance on a single system instead of scattered spreadsheets and paper.
The platform supports your pre-existing programs right out of the box. It can intuitively handle safety and BBSO, quality checks, master sanitation schedules, 5S/6S, autonomous maintenance, and production tracking. Every form on Weever is modelled on the paper checklists your team already knows, so there's no retraining or redesign to get started.
Getting started is one thing. Paying for it as you grow is another, and that's where Weever breaks from most tools on this list. The platform is priced per site, not per user. That matters more as you scale. If you're running one site with 15 people, you'll barely notice the difference, but if you're running several plants with hundreds of operators, per-seat pricing means paying for every one of them. With Weever, adding a new site or shift doesn't require a new negotiation.
Additionally, every check on Weever feeds into the same loop, keeping everything connected. A failed check or flagged issue automatically becomes an action item with an owner and a due date, and it stays open until someone closes it, not until someone remembers to check a binder.
Weever also offers AI capabilities. Instead of digging through dashboards to find what's wrong, you can ask Weever AI directly, and it turns your frontline data into answers and recommendations.
Book a demo to see how Weever connects your checklists and actions with decision and continuous process improvement.
Key features
- Configurable digital forms: Your existing checklists, logs, and inspections become digital forms with conditional logic, mandatory fields, thresholds, and supervisor sign-off, configured to match how the plant already works.
- Multilingual, multi-site rollout: Forms and instructions run in multiple languages across sites. It also has central templates and site-level configuration for standardized scoring and reporting.
- Scheduling and QR code access: Tasks are scheduled by area, shift, or frequency. QR codes at the line open the right form on a shared device, no app install, no per-person login.
- Action Tracking Workflow Automation: Failed checks and flagged issues automatically become owned, due-dated action items.
- Weever Radar (AI): Ask Radar directly instead of digging through dashboards. It turns frontline data into answers, insights, and recommendations.
- Evidence capture and audit trails: Photos, video, sketches, and e-signatures attach directly to a task. Records are timestamped and audit-ready, and Weever is attested compliant with FDA 21 CFR Part 11 and EU Annex 11.
- Shift handover logs: Outgoing and incoming shifts share the same record of what happened, what's still open, and what needs attention next.
- Real-time dashboards and open data: Completion rates, open actions, and risk trends by line, shift, and site, with data exports via OData, Excel, and MCP, and integrations into SAP, MES, and CMMS.
Pros
- Low learning curve for operators
- Removes the manual step of re-keying paper forms into Excel before the data is usable
- Data connects into systems you already run: SAP, MES, CMMS, and BI tools like Power BI
- Change forms and workflows on the fly with no dev skills
- Every submission is timestamped and tied to a person, building the audit trail and accountability your team needs
Cons
- No native sensor or IoT connectivity to pull machine data directly off equipment. While this can often be closed through Weever's integrations, the platform itself doesn't collect it firsthand.
Pricing
Weever pricing depends on your site count, the programs you want to run, and the configuration you need. No hidden costs or per-seat licenses. Start with one program and add the rest later without renegotiating. Book a demo today!
2. SafetyCulture
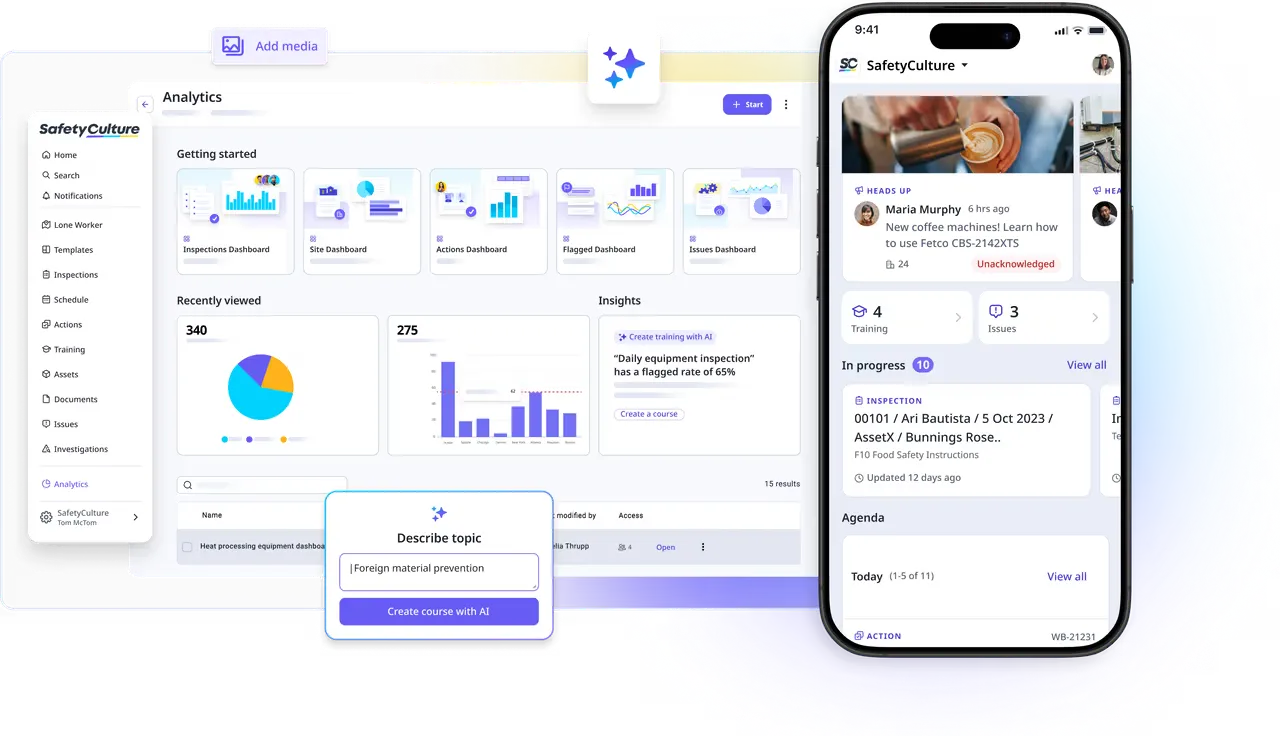
SafetyCulture (formerly iAuditor) is a workplace operations platform used across manufacturing, construction, retail, hospitality, logistics, and mining. It’s primarily inspection, audit, and checklist software, but it also includes training, task management, and asset management features. You get a library of 10,000+ templates, making it easier to get started on the platform.
The tradeoff with SafetyCulture? Since it’s designed as a general worker platform, it might be too broad for businesses that need a platform focused on manufacturing programs.
Key features
- Inspections and audits: Access mobile-first checklists that your team can run on any device, with photo capture and offline access for areas of the plant where the signal drops.
- Template library: 10,000 customizable checklists and course templates, so you won’t have to build every form from a blank page.
- Built-in AI: AI capabilities included in every plan help you create checklists and training, answer questions from your documents, and translate content into 15 languages.
- Training and courses: Convert your SOPs into courses, then deliver and track completion in the same platform your team already uses for inspections.
Pros
- Easy to adapt to and use for frontline teams
- Free plan available to test the platform before committing to a paid plan
- Very large template library of around 10,000+ templates that saves you setup time
- Works offline, which is useful for plants in remote or low-signal areas
Cons
- Per-seat pricing on the Premium plan can get expensive for larger teams of operators
- Customization is limited, so advanced workflows or specific reporting needs can be hard to configure without workarounds
Pricing
SafetyCulture comes with a free plan for teams of up to 10 users. It gives you 5 active inspection templates and basic analytics.
The Premium plan, designed for teams of around 11-100 members, is $24 per seat per month when billed annually, or $29 per seat per month when billed monthly. Enterprise pricing is custom, with an option for site-based pricing. Contact their sales team for exact pricing figures.
3. Poka
Poka is a Connected Worker Platform that focuses specifically on manufacturing. The platform specializes in learning and development, including digital work instructions, skills management, and factory floor training. It also covers daily management, including forms, checklists, issue management, and tiered meetings.
Poka is a good platform to consider if the biggest challenge you’re facing right now is training your operators and capturing knowledge.
Key features
- Digital work instructions and troubleshooting: Build step-by-step instructions with video and images. Your operators can then refer to them at the line when they get stuck on something.
- Skills management: Poka’s skills matrix tracks who is trained on what, making it easier to see gaps before you schedule someone on a line they aren’t certified for.
- Forms and issue management: Digital forms and checklists for daily checks, along with issue tracking so problems are logged and followed up on instead of being mentioned in passing.
- Frontline knowledge capture: Your operators can record short videos and share tips or fixes with the rest of the plant.
Pros
- Made with the manufacturing industry in mind and not a general-purpose tool
- Users report that Poka’s interface is intuitive and easy to use, especially in high-volume environments
- Create work instructions within the tool without any blockers whatsoever
- Good for knowledge sharing and communication between shifts and teams
Cons
- The platform can be difficult to navigate, especially for new users
- Some users face integration issues when connecting Poka with existing systems and workflows
- Feature limitations in large-scale operations, along with slow feature updates
Pricing
Poka doesn't publish its pricing publicly. You can contact the support team by filling out the form on the pricing page with your personal and company details.
4. L2L
L2L is a connected manufacturing operations platform, with a different focus from the rest of this list. Rather than checklists or training, it prioritizes highlighting downtime and disruptions on the line. The platform captures every stoppage, dispatches the right person to fix it, and tracks how long the response took.
If your main problems are unplanned downtime and slow maintenance response times, L2L might be your best option.
Key features
- Dispatch and work order management: Dispatch tasks to specific people, set urgency levels, and track how long each job took to close out.
- Preventive maintenance: Schedule inspections and repairs to reduce the likelihood of equipment failures. This is one of the features L2L users rate most highly.
- Shop floor execution: Get real-time visibility into what's happening on every line and every shift, including disruptions and fixes.
- Digital checklists and audits: L2L’s standard work and digital audits ensure tasks get done consistently, regardless of who’s on shift
Pros
- Downtime, dispatch, and work orders are all in one flow, with no need to re-enter anything
- Basic processes like creating, closing, and opening work orders are fast and simple to do
- Real-time status updates connect back to specific production areas
- Reminders help you make sure you don’t forget recurring tasks
Cons
- Several users report the setup is complicated and the initial learning curve is high, with one user also highlighting daily login issues
- Certain features can be difficult to find or navigate to on the platform
- It's built around maintenance and downtime, so it's not as good of a fit as Weever if you're mainly running sanitation, quality, or 5S programs
Pricing
L2L doesn't have publicly available pricing on its website. You can reach out to their sales team for a custom quote using the contact form.
5. Parsable
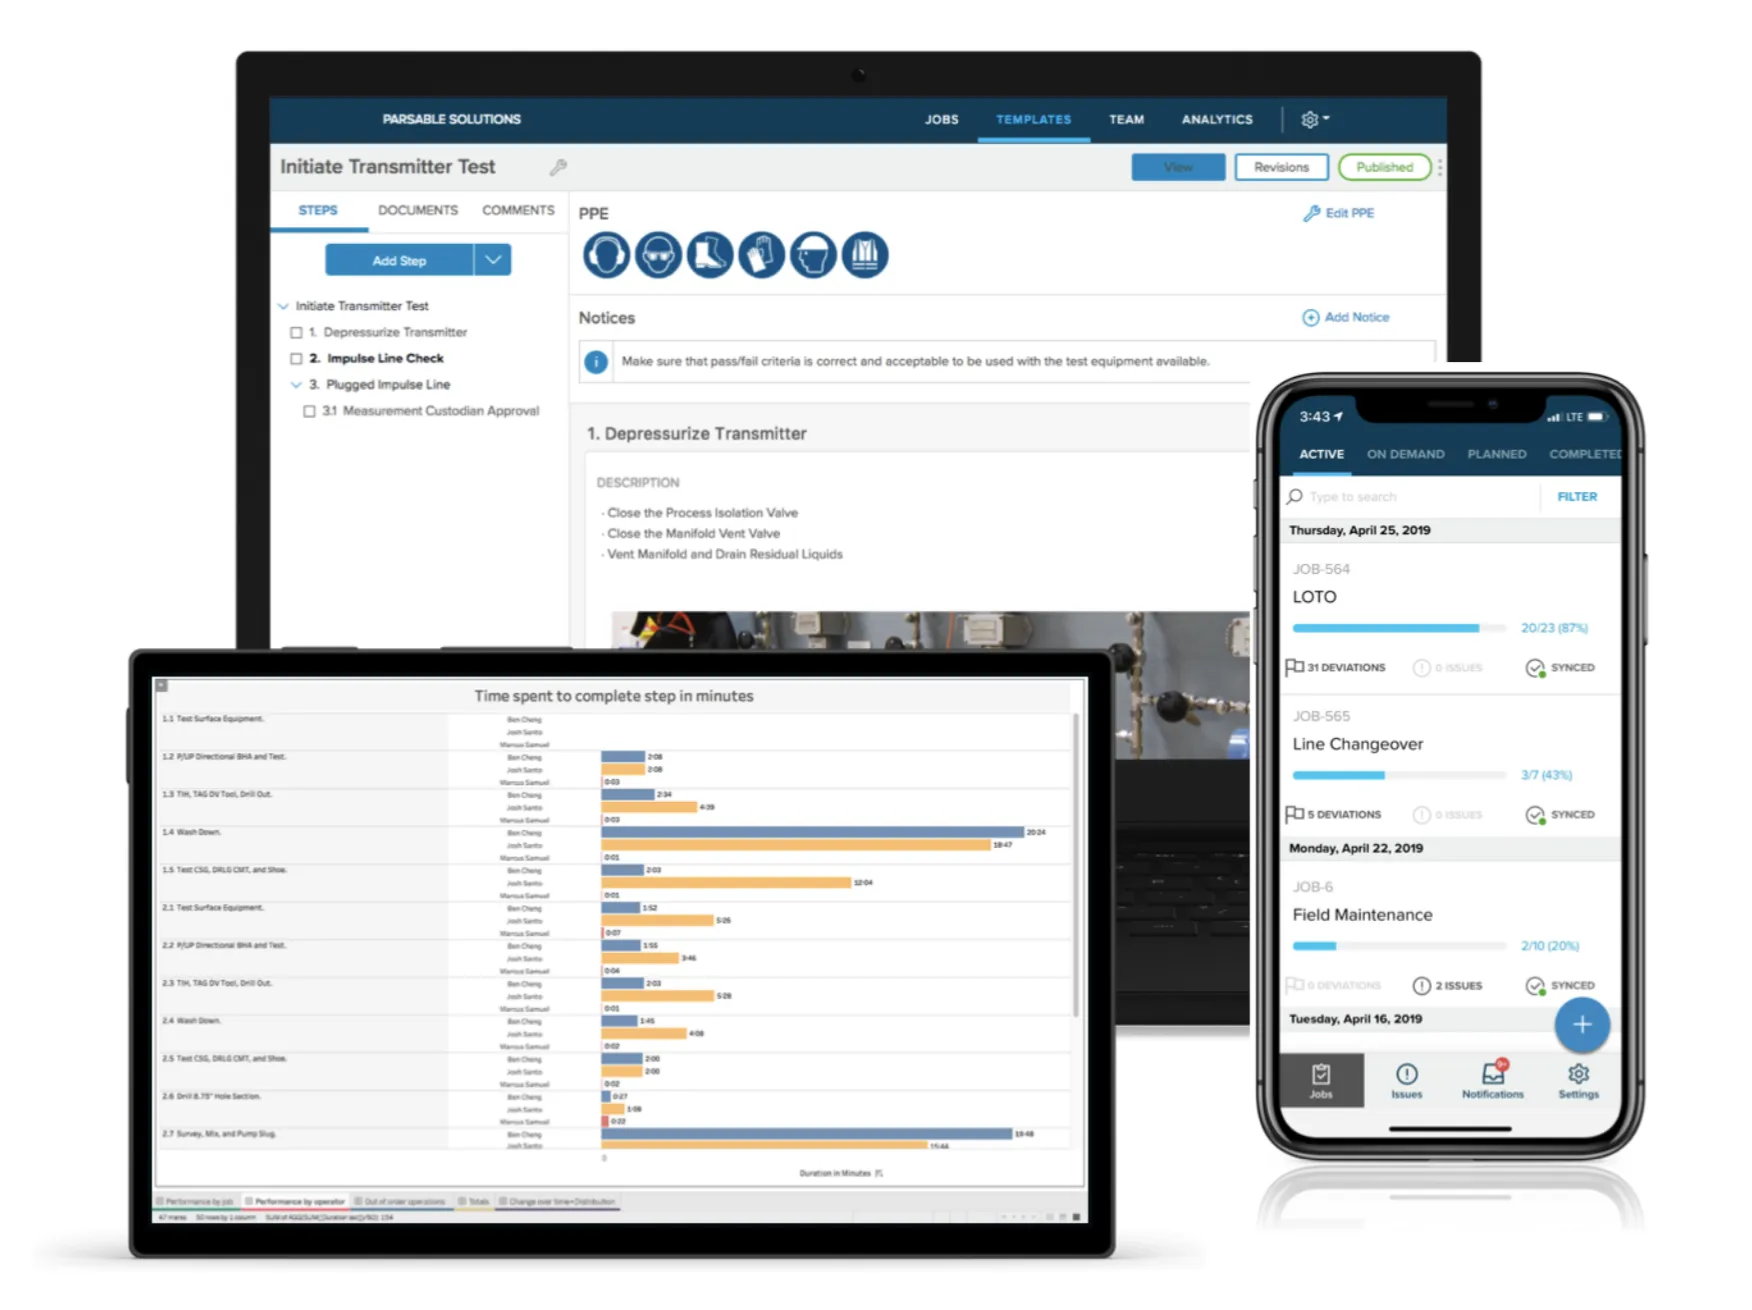
Parsable, now part of CAI Software following its acquisition in 2024, is all about digital work instructions and structured frontline execution. It takes paper SOPs, converts them into step-by-step digital procedures, and then records the data as operators work through them.
It covers manufacturing and heavier industries like oil and gas, with use cases spanning maintenance, production, quality, safety, and ESG.
Key features
- Digital work instructions: Create, update, and distribute step-by-step SOPs across sites, with photos, video, and files attached to individual job steps.
- Audits and inspections: Automate the processing and tracking of routine audits, inspections, and checklists that your frontline runs.
- Workflow and collaboration: Your teams can post questions, report issues, or share expertise using the messaging feature. Every message is related to a specific assignment, with the option to tag workers directly in comments.
- Real-time integrations: Connect Parsable with other systems you use to improve work executions.
Pros
- The software interface is highly intuitive, especially when building or modifying checklists
- Create and attach photos, video, and SOP files to individual job steps easily
- Users find the collaboration feature helpful, highlighting the comment fields and the ability to tag a specific person or group
- Good API set for when you want to connect to other systems
Cons
- Parsable’s scheduling system is less advanced than other competitors, with no calendar view to see jobs in advance
- Several users say that configuring conditional steps feels awkward and confusing
- Time tracking against allocated versus actual time is not as detailed as it should be for production lines
Pricing
Parsable doesn't have public pricing. You must schedule a demo or contact their sales team to get a custom quote tailored to your requirements.
6. Augmentir
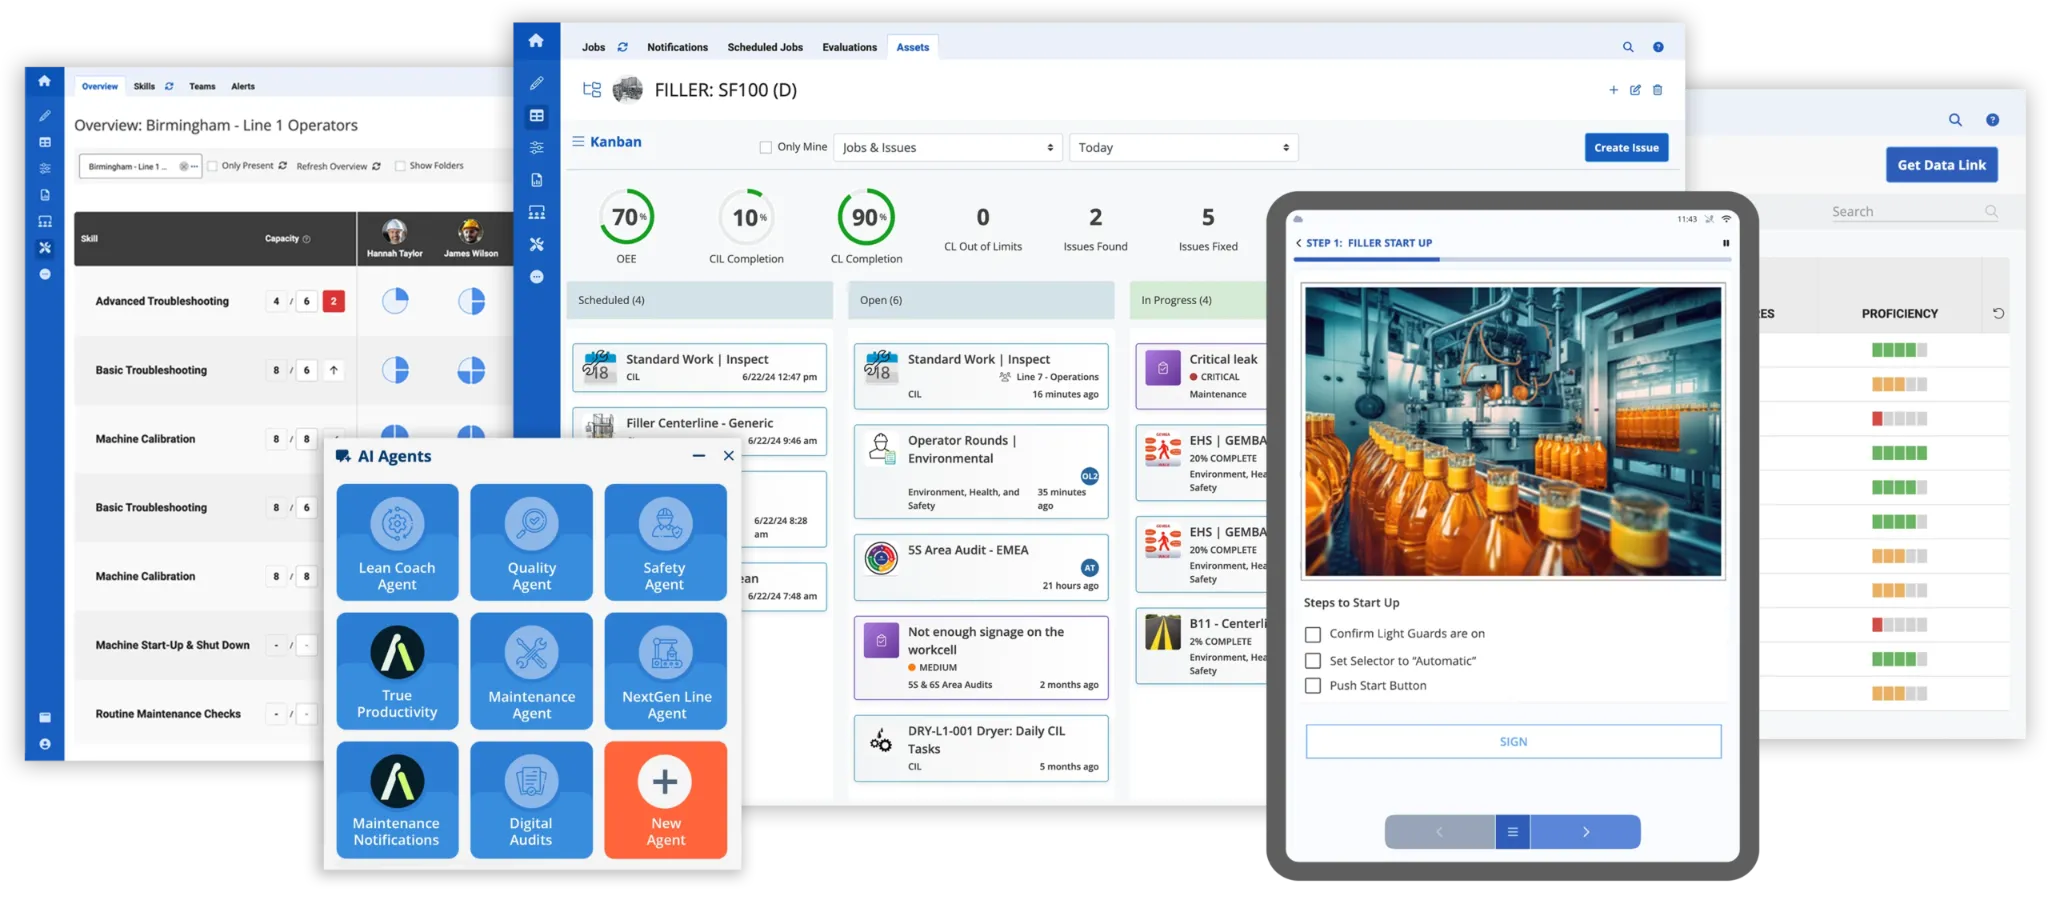
Augmentir is an AI-first Connected Worker Platform. It leads with its AI layer but also includes necessary features like digital work instructions, skills management, issue tracking, and asset management.
It gives you a generative AI assistant, Augie, that helps operators and managers solve problems much faster. Augmentir also lets you build custom AI industrial agents without writing any code.
Key features
- Augie generative AI assistant: The Gen AI assistant compiles your existing content from Excel, Word, PDFs, images, or videos. It then generates digital forms, checklists, and work instructions for you from your own data.
- Custom AI agents: Augmentir’s AI Agent Studio helps you create and launch your own custom AI agents related to training, skills, safety, quality, operations, and maintenance without writing a single line of code
- Digital work instructions: Access no-code authoring tools and a workflow builder to digitize frontline work, such as 5S audits, layered process audits, and safe work permits.
- Skills and training management: Digitize the full skills lifecycle to identify gaps in the skills matrix and discover who needs reskilling within your team.
Pros
- Augmentir is highly customizable, with strong functionality
- Support team is highly responsive with actual solutions and not generic replies
- Easily take and document photos
- Broad industry coverage with a wide set of use cases in one platform
Cons
- User interface is not as intuitive as competitor platforms
- Platform is missing some advanced features according to some users
- Single sign-on and ERP/CRM connectors are add-ons and not included in the base subscription
Pricing
Augmentir has subscription-based pricing. The base subscription includes:
- Workflow authoring
- Skills management
- Remote collaboration
- AI analytics
- API access
- Guided onboarding
- And a customer success team
For exact pricing details, you’ll need to contact Augmentir’s sales team for a custom quote.
7. Tulip
Unlike other Connected Worker Platforms on this list, Tulip offers a no-code, drag-and-drop app builder and a connectivity layer that pulls in data from your machines, sensors, and devices. That combination is where Tulip is strongest. If your operator input and machine data currently live in two separate places, Tulip is built to bring them into one app.
The tradeoff is that there's no MSS module or 5S audit program waiting for you to configure. Someone on your team has to build one first, using either the app library as a starting point or a blank canvas, and then maintain it as your process changes. Tulip is a good fit if you have the internal capacity for that and a process no off-the-shelf platform matches. It's a harder sell if you need your sanitation schedule live by the end of the month.
Key features
- No-code app builder: The drag-and-drop no-code app builder turns SOPs, photos, diagrams, and videos into connected apps. It also has a library of ready-made solutions that you can start with.
- Machine and sensor connectivity: There are hundreds of pre-built connectors and drivers for CNC machines, PLCs, sensors, devices, ERPs, WMSs, and older equipment. Machine data lands in the same app as operator input, so you can see what the line was doing at the moment a check was logged.
- Compliance features: Access eSignatures for 21 CFR Part 11, auditable record history for GxP and AS9100, validation packs, and a full history record for audit readiness.
- Native AI and analytics: Tulip’s AI auto-translates instructions, extracts insights, and provides trained chats. You also get dashboards for tracking production data.
Pros
- Building and deploying solutions is quick and easy
- Intuitive user interface for building apps, even for complex use cases
- Strong community backing with university courses and a knowledge hub for learning the platform
Cons
- Some Tulip users say that the Tulip Tables could be more robust with larger datasets
- Since it’s totally cloud-based, it makes it harder to figure out where a connection or latency problem is coming from
- Requires more internal effort than a platform that has ready-to-go programs since you have to build the apps yourself
Pricing
Tulip has four pricing plans, all of which require at least 10 interfaces.
- Essentials: $100 per interface per month, billed annually
- Professional: $250 per interface per month, billed annually
- Enterprise: Custom pricing, contact sales to get a quote
- Regulated Industries: Custom pricing, contact sales to get a quote
Things like machine monitoring, computer vision, premium support, and professional services are separate add-ons, which will cost you extra.
8. Redzone
Redzone (RZ Software) is now part of QAD after the acquisition in 2023. It’s for frontline manufacturing teams, and the software focuses on productivity and engagement rather than just digitizing paperwork. There are four Redzone products: Productivity, Compliance, Reliability, and Learning.
It’s primarily a Connected Worker Platform that provides real-time production data and encourages crew members to actively participate rather than simply record readings.
Key features
- Real-time production data: Get live plant floor data, allowing your teams to see losses as they happen. They can then act on them during the shift instead of finding out the next morning.
- ChampionAI: Redzone’s AI layer provides agents that can flag issues early, surface patterns, and predict downtime before it happens.
- Compliance and quality management: Digital audits, inspections, and product quality checks happen in real time. It also includes paperless documentation, which is tracked by shift, line, and SKU.
- Learning management: Gain access to an LMS for onboarding and training purposes.
Pros
- Platform interface allows you to make changes to the software quickly, be it configuring datasheets or changing events
- Access real-time production data from your mobile devices
- Eliminates manual quality and operator checks
- Implementation team provides good training along with any onboarding support you need
Cons
- Users report difficulties while configuring triggers
- Once a sign-off is complete, you can only void checks rather than delete or cancel records
- No option to copy production checks over to quality checks or the other way around
Pricing
Redzone has custom pricing. The price you pay depends on the size of your factory and how you plan to deploy it. You'll have to contact their sales team or request a demo to get a quote.
How to choose a Connected Worker Platform for manufacturing
A few things worth checking before you commit to a Connected Worker Platform:
- Test it on your worst form, not your cleanest. Send the vendor a 40-line sanitation log with a conditional allergen-changeover section. Watch how they handle it in the demo. Most tools look fine on a simple five-question checklist.
- Know what happens after a check fails. Does it become an owned, due-dated action item? Or does it just sit on a dashboard until someone notices eventually?
- Check how it connects to your equipment, not just your forms. If downtime or machine-level data is your bigger problem, look for direct equipment or PLC connectivity. Don't settle for a system that only logs what an operator typed.
- Ask how it captures knowledge, not just data. If tribal knowledge and operator turnover worry you more than paperwork, prioritize skills tracking and training over forms alone.
- Count who actually needs access. Per-seat pricing works fine for a small team. Past around 100 people on a site, site-wide pricing usually costs less.
- Ask what you own after go-live. Some vendors hand you a login and a help center. Others stay involved through configuration and rollout. Decide which one you're buying.
- Match the tool to the program you actually run, not the one with the most features. If your real problem is 5S or sanitation, a platform built around downtime response isn't the right fit, and vice versa.
The right platform fits how your plant already runs. It connects what's currently disconnected and is actually used after the pilot.
Go with a platform that is aligned with how your plant already runs
Eight platforms, one category, and no single tool covers all the jobs. Some connect workers. Some connect to the equipment they run. Some others connect to the systems already holding your plant's data. A few connect the knowledge that would otherwise walk out the door with an experienced operator. Where each one is strong tells you more than any feature list alone.
If you're running a process manufacturing plant, especially in food and beverage, CPG, or pharma, Weever is built around exactly this. It runs your safety, sanitation, quality, and autonomous maintenance programs on one system. It's priced per site instead of per seat, so every operator gets access without a fight over licenses.
Book a demo with Weever and see how it connects your checklists and actions, not just digitizes them. No commitment required.
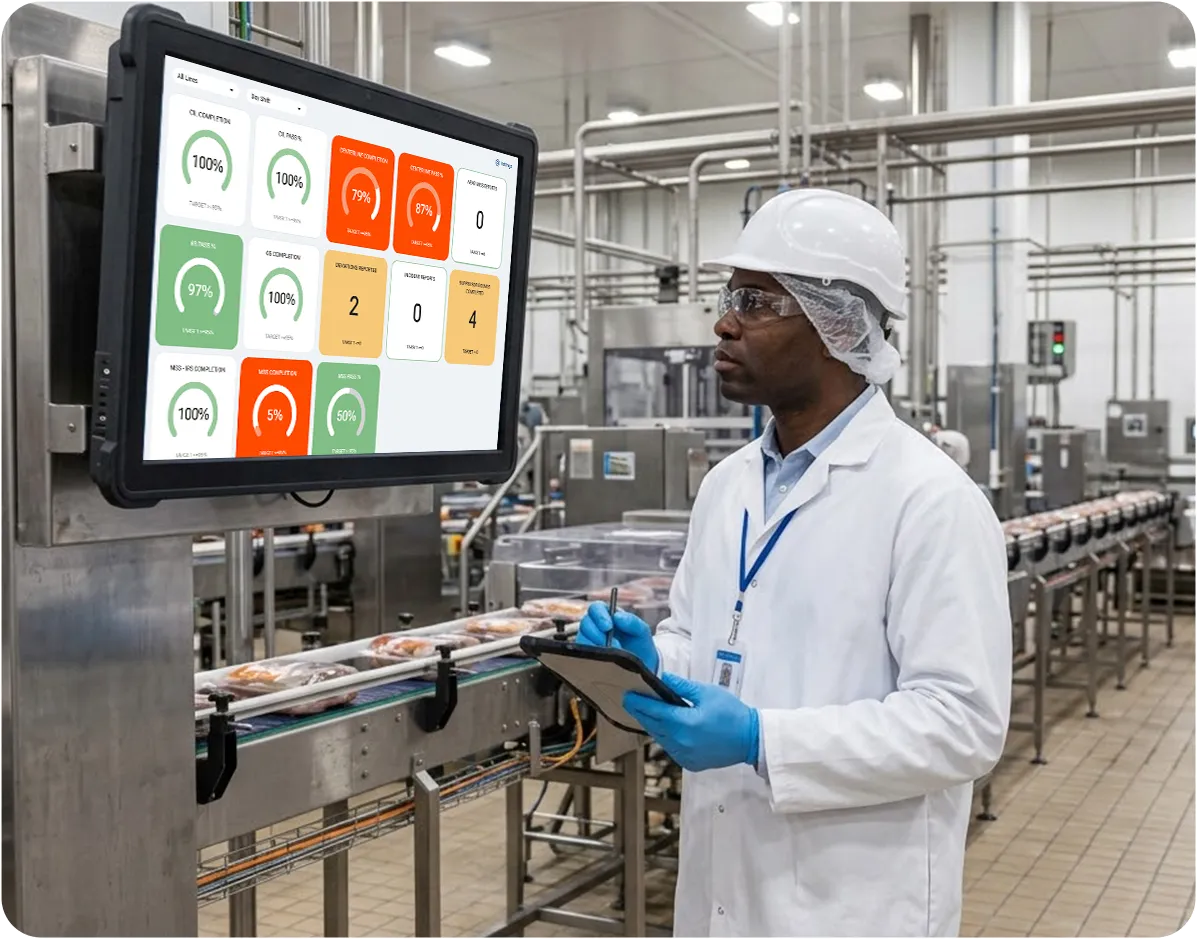
Digitizing Standard Work: 10 Best Manufacturing Work Instruction Software
Quick Summary
Work instruction software replaces paper SOPs, one-point lessons (OPLs), and centerline standards with guided digital workflows that operators can follow on the shop floor. The right pick depends on whether you need action tracking, audit checklists, or production-data integration built in. Here are our top three picks:
| # | Platform | Best for |
|---|---|---|
| 1 | Weever | Best for CPG process manufacturing plants managing standard work across multiple sites |
| 2 | SafetyCulture | Teams that want general audit checklists |
| 3 | Poka | Standards built and shared via TWI-style lessons |
Why does manufacturing need work instruction software in 2026?
Manufacturers spend thousands of hours creating standard operating procedures. But all that work comes to nothing if those standards aren’t followed consistently on the shop floor.
The challenge is that as production changes, instructions become outdated, operators develop workarounds, and supervisors lose visibility into whether processes are being followed correctly. That failure to follow due process leads to more defects, rework, downtime, and audit findings.
That’s where digital work instruction software comes in. A 2026 field study published in the Journal of Manufacturing Technology Management found digital work instructions cut task completion time by 16–20%, reduced errors by 46–60%, and lowered help requests by 69–83% compared to paper, with directionally similar gains reported across other manufacturing studies.
This article compares the best work instruction software for manufacturing in 2026 to help you find the right platform for your team.
Why listen to us?
The Weever leadership comes from a manufacturing background. We didn't study floor operations from a distance. We’ve been a part of them, living through the exact challenges this list is about: getting operators to actually follow a standard, every shift, not just glance at it. Today, Weever runs live at plants including Walmart, Royal Canin, Mars Snacking, and Monin. Operators, supervisors, and plant managers tell us where instructions get skipped or filled out on autopilot. That feedback, plus our experiences, gives us the exact know-how of what works on a factory floor and what doesn’t.

.avif)
What is Work Instruction Software?
Work instruction software is a digital tool that guides operators through a task step- by- step, replacing paper forms and binders taped to machines.
Manufacturers use it to digitize standard work across the floor, including SOPs, one-point lessons, centerline standards, quality checks, changeover procedures, sanitation and cleaning steps, safety requirements, and more.
Work instruction platforms vary in scope. Some focus on delivering digital guidance, while others also include action tracking, audit management, production data, and workflow automation. The best manufacturing platforms deliver these on shared, shop-floor devices, with QR-code access, no per-person login required, so the instruction holds up across shifts, languages, and sites.
How work instructions drive manufacturing results
Here's how well-defined work instructions change what happens on the floor:
- Faster Onboarding: A new operator follows guided, visual steps instead of reading pages of text, so they're productive on a new line or task in just a few days.
- Fewer Errors: Built-in checks and required photos catch mistakes at the step where they happen, before they turn into scrap, rework, or a customer complaint.
- Shift-to-shift Consistency: Every crew works from the same live version of the standard, so there's no gap between what the day shift does and what the night shift does.
- Audit-readiness: Every completed instruction is logged automatically, so proving what was done, when, and by whom takes minutes instead of digging through binders.
- Faster Follow-up (where platforms support it): When a step fails or gets flagged, it can become an owned, tracked action with a deadline. However, not every instruction tool tracks that action through to verified closure, confirming it was fixed rather than just logged. Weever is one of the few exceptions.
10 best work instruction software for manufacturing compared
| # | Platform | Best for | Starting price | Key differentiator | Free trial |
|---|---|---|---|---|---|
| 1 | Weever | Best for process manufacturing plants managing standard work across the shop floor | Custom, site-wide pricing | One platform for 5S, AM, safety, sanitation, and quality | Available via demo request |
| 2 | SafetyCulture | Teams that need general audit checklists | Free (up to 10 users); $24/user/month paid | Massive template library across safety and quality | 30-day trial on paid plans |
| 3 | Poka | Standards built and shared via TWI-style lessons | Available on request | Auto-translation, multimedia-heavy lessons | Not publicly listed |
| 4 | RZ Software (Redzone) | Work instructions with shift communication and lean tools | Custom (enterprise) | Shift-based OEE scoring, digital huddles, and handoff notes | Not publicly listed |
| 5 | Augmentir | AI-personalized guidance by worker skill level | Custom (enterprise) | AI/AR-driven, adapts instructions to the operator | None publicly listed |
| 6 | Intellect | Regulated manufacturers needing a full QMS | $26,000/year (Core plan) | Deep FDA/ISO/GxP compliance tooling | Available on request |
| 7 | Dozuki | SOP authoring and standards training | Available on request | Reduces onboarding and changeover time | No free trial; free templates only |
| 8 | Parsable | Remote expert collaboration inside instructions | Not published (est. $80–$300+/user/month) | Real-time collaboration built into the instruction | None; 30-min Jump Start Session + demo |
| 9 | L2L | Skills-based training tied to work instructions | Custom, quoted | Live skills matrix connected to operator training and qualification tracking | Not publicly listed |
| 10 | VKS | Visual work instructions and faster operator training | Available on request | Interactive annotations and mass updates across instruction templates | 30-day trial + 60-day on-site pilot |
1. Weever - Best for multi-site CPG process manufacturing plants
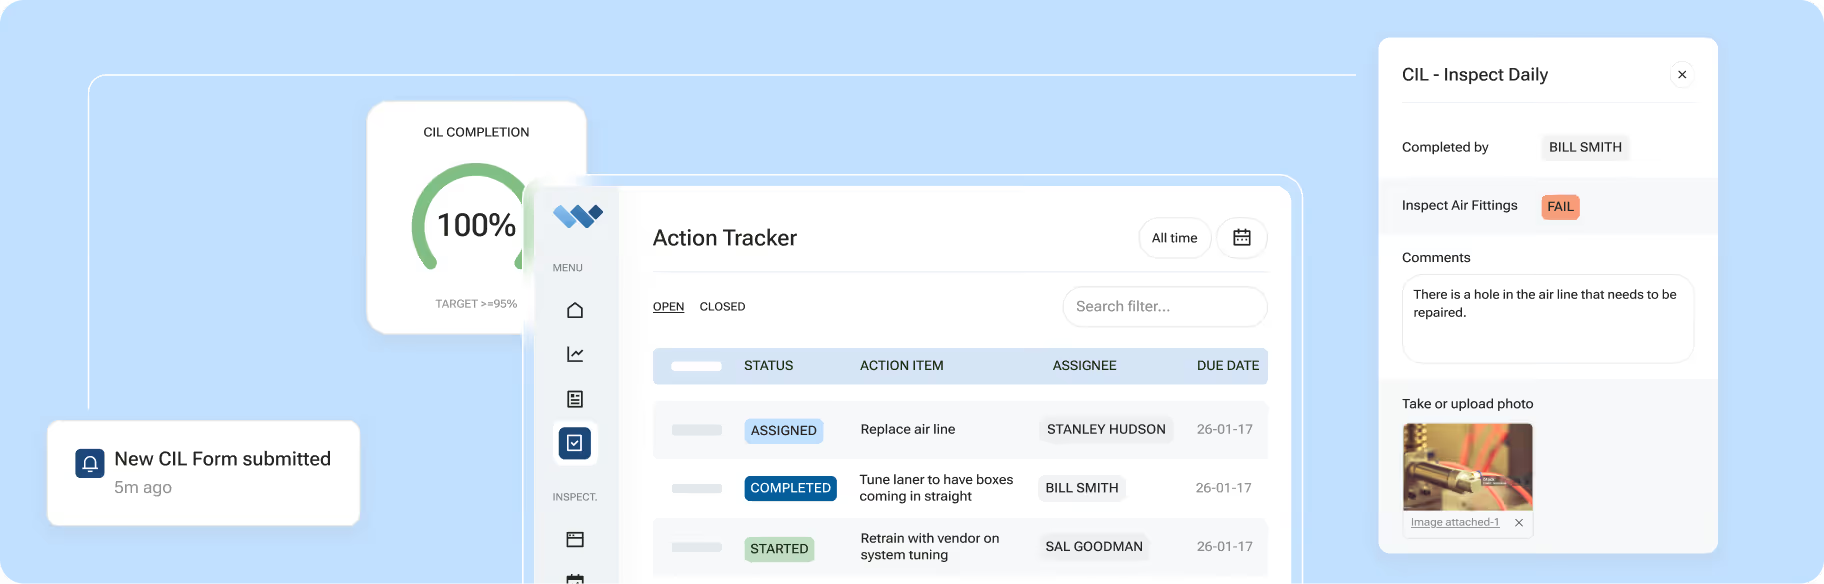
Weever is a connected frontline operations platform for process manufacturing plants. It delivers work instructions across autonomous maintenance, quality checks, sanitation (SSOPs), safety, and 5S programs, converting SOPs, OPLs, and centerline standards into guided digital workflows.
Operators follow each step on shared tablets, phones, or workstation devices. Along the way, they record measurements, add evidence, sign off on tasks, and report abnormalities. Basic checks are in place to flag an entry the moment something looks wrong.
However, Weever is more than just a work instruction delivery platform. It also manages what happens after operators complete a check or report an issue through its core Capture, Act, and Analyze model:

- Capture: Operators complete scheduled checks, enter measurements, add photos or videos, sign off on tasks, and report abnormalities
- Act: Failed checks and flagged defects trigger alerts, follow-up fields, deviation workflows, or an action item with an owner and due date.
- Analyze: Completion records, non-conformances, overdue actions, and operational trends flow into real-time dashboards by line, shift, site, or region
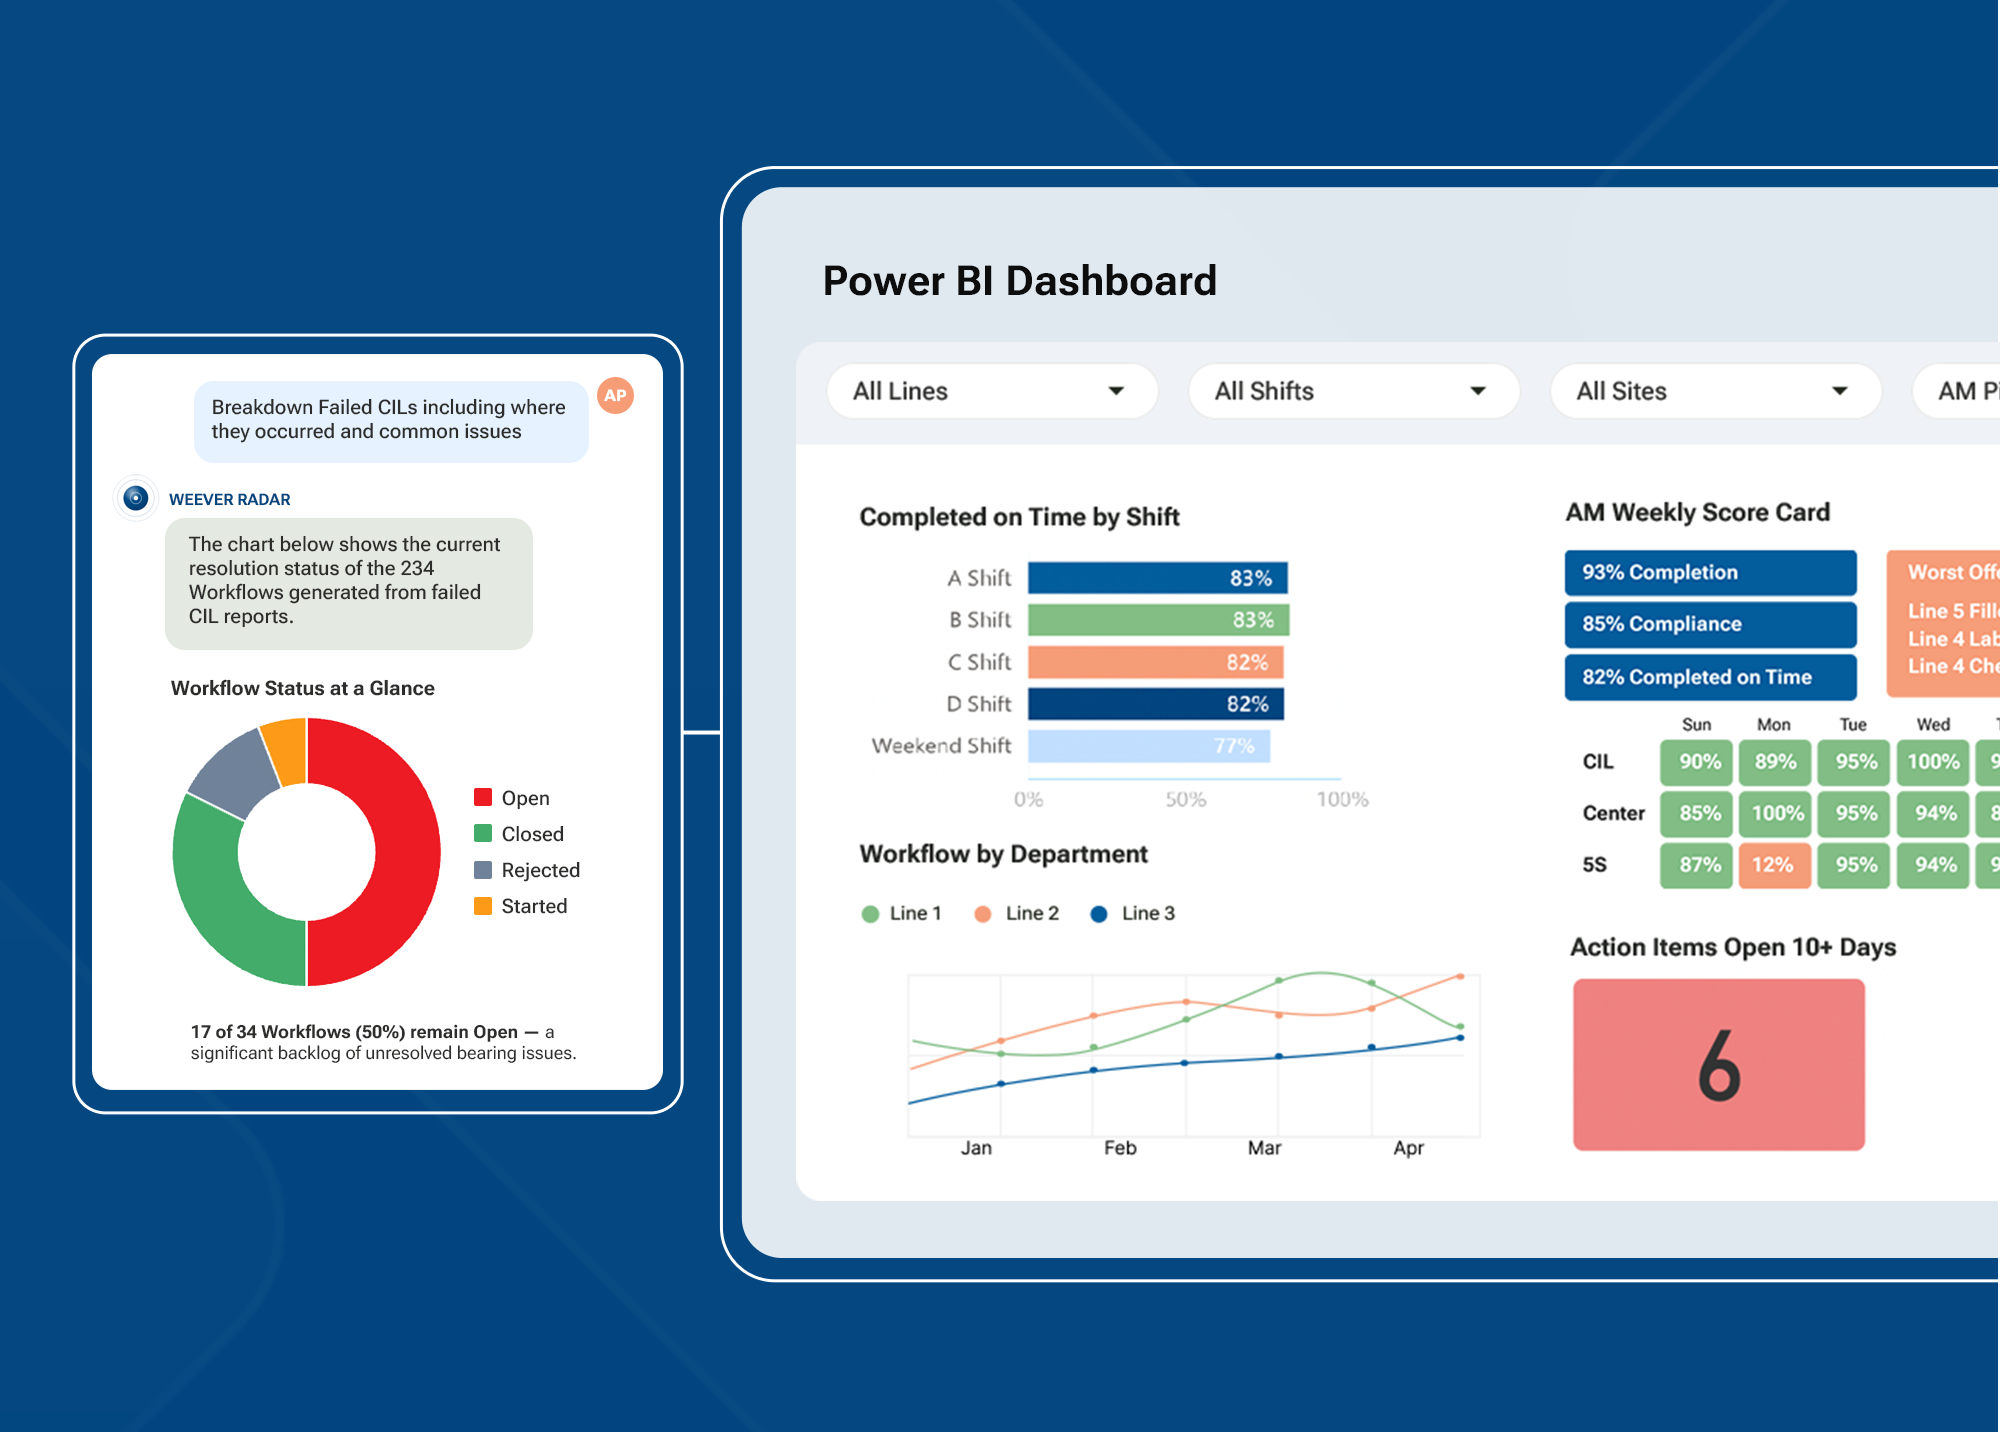
This Capture, Act, and Analyze model comes especially useful in food and beverage plants, where instructions involve sanitation SSOPs, line clearances, allergen changeovers, temperature or pH checks, and quality inspections.
The platform scales across sites, giving supervisors local visibility while plant and corporate leaders get cross-facility comparisons
While Weever doesn't ship a pre-built "allergen lockout" feature, plants can build one using the available tools. Conditional logic reveals a required cleaning checklist when an operator selects an allergen changeover. Required fields keep the operator from skipping steps. A supervisor sign-off closes out the record before the line restarts.
The same configurability applies to mandatory data constraints. Acceptable-value ranges can block a temperature or pH entry that falls outside the safe range. The reading gets flagged for review instead of passing through unnoticed.
This pattern repeats for non-conformance triggers. A defective batch seal, for example, can automatically notify the quality assurance team the moment it's flagged.
Key features
- Interactive Digital Workflows: Convert SOPs, OPLs, centerline standards, inspections, and checklists into guided workflows with embedded photos, videos, and visual instructions.
- Loop-Back Alerts: Notify the person who reported an issue once it is resolved, so operators can see that their input led to action.
- Frontline QR-Code Access: Let operators open the correct workflow from shared tablets, phones, or workstation devices by scanning a QR code.
- Conditional Logic and Data Controls: Use required fields, acceptable-value ranges, supervisor approvals, and follow-up steps to control how operators move through a workflow.
- Automatic Action Items: Created the moment a step fails or an issue is flagged, with no manual entry required.
- Weever Radar™: An optional AI layer that identifies patterns across observations, checks, and sign-offs, helping teams spot issues before they lead to downtime, quality holds, or audit findings.
- Site, Line, and Shift Views: Review data at the line, shift, site, or corporate level, giving each team the level of visibility it needs.
- Enterprise Integrations: Connect Weever with ERP, CMMS, Power BI, SSO, and other business systems.
- A.D.A.P.T. Onboarding: Follow a structured implementation process covering Assess, Digitize, Align, Prepare, and Tune, with hands-on support throughout rollout.
Pros
- Instructions connect directly to action tracking and analytics, not just viewing
- Multilingual support and offline-friendly design make the platform practical for distributed frontline teams
- One platform covers every major frontline program instead of a single point solution
- Multimedia guidance makes procedures easier to follow on the floor
- Photos, videos, signatures, and timestamps create a clear audit trail
- Revision control helps keep teams on the latest approved procedure
Cons
- Broader scope than a team that only wants a standalone instruction viewer
Why we picked this
We built Weever, so our placement on this list is naturally biased. But look past that, and Weever has a lot to offer as a work instruction tool and beyond, starting with configurability. Manufacturing plants can adapt workflows to their own operational requirements without relying on custom development.
Furthermore, conditional logic, validation controls, approvals, and automatic actions make it especially useful when failed checks require immediate follow-up. Weever also mirrors how teams already fill out paper checklists, so adoption tends to be fast with no retraining.
What customers are saying
- Monin, a global flavoring syrup manufacturer, saved 3–4 hours a day on data management and reporting, expanding to every North American facility within 5 months.
- Royal Canin, the pet food manufacturer, reached a 95% close rate on nearly 3,000 logged abnormalities, saving over 7,000 hours a year.
“Weever removed barriers, making it easy for associates to report issues, and the data’s accuracy gave everyone confidence in the process,” says Sergei Pinchuk, Supply Excellence Manager at Royal Canin.
- Adient, an automotive seating manufacturer, saw its 5S scores rise from 85% to 97%, with open issues dropping from 60+ a month to fewer than 5.
Pricing
Custom, site-wide pricing with unlimited users per site.
Free trial
Available via demo request.
Book a demo to see how Weever works for your floor.
2. SafetyCulture
SafetyCulture (formerly iAuditor) is an audit-app platform with a large library of pre-built templates, including work instruction checklists.
Its strength is thousands of templates across safety, quality, and general inspections. Where it's thinner is depth, as work instructions here function as one checklist type among many, rather than being tied natively into a broader maintenance, sanitation, or 5S action-tracking system the way Weever's are.
Key features
- Template Library: Access thousands of pre-built checklists and forms covering safety, quality, and general inspections, so setup starts from a template instead of a blank page.
- QR Code Issue Flagging: Flag a problem on the floor, document it with photos and video, and share the report with the team immediately.
- Custom Report Layouts: Customize and brand inspection reports, choosing what content and structure to show for different audiences or use cases
Pros
- Offers a free version for teams up to 10 users
- Very large template library for fast setup
- Well-established, widely reviewed platform
Cons
- Updating existing inspection templates or report layouts can be complex
- Less native connection between an instruction and a broader program like AM or sanitation
Why we picked this
SafetyCulture is a reasonable fit if audits are your main need and instructions are secondary. Manufacturers running dedicated programs like AM, MSS, or 5S find the action-tracking layer thinner than a platform built around those programs from the start.
Pricing
Free for teams of up to 10 users. The Premium plan starts from $24/user/month billed annually ($29/month billed monthly).
Free trial
30-day free trial on paid plans.
3. Poka
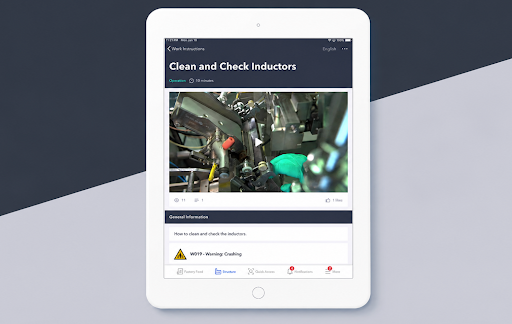
Poka is a connected worker platform built around Training Within Industry (TWI)-style lessons that function as Poka's version of work instructions, complementing standard operating procedures. Over a thousand companies use its lesson format to build and share standards across teams, with multimedia support and built-in auto-translation.
Poka handles the authoring and sharing side well. Where it's lighter is on follow-through; assigning and escalating a failed step as an owned action across a broader program isn't the platform's core strength.
Key features
- Multimedia Lessons: Build standards using video, images, and annotations, so instructions show the task instead of just describing it.
- Auto-Translation: Lessons adapt across languages automatically, reducing the manual work of maintaining separate versions for multilingual crews.
- QR Code Access: Operators scan a code at the workstation to pull up the relevant lesson, without a personal login.
Pros
- Strong multimedia and auto-translation for multilingual crews
- TWI-based lesson format is well-suited to skills training
- Established connected worker platform with broad manufacturing use
Cons
- Integrating into a broader manufacturing environment is harder when other systems are already the primary data source
- Action tracking is less central than in a platform built around it
Why we picked this
Poka is a strong choice for manufacturers whose main need is building and translating training-style lessons across a multilingual floor.
Pricing
Subscription-based pricing available on request.
Free trial
Not publicly listed.
4. RZ Software (Redzone)
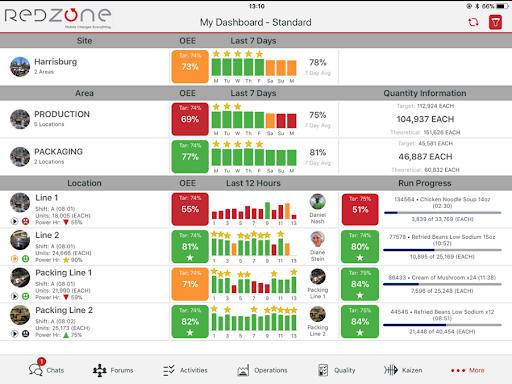
Redzone combines digital work instructions with production management, shift communication, and workforce collaboration tools. Its built-in lean tools give teams structured ways to review recurring production problems, while shift-based scoring keeps performance discussions tied to each crew.
Key features
- Digital Huddles and Lean Tools: Built-in templates for daily huddles, Pareto charts, and 5 Whys structure how teams work through recurring problems
- Shift-Based OEE Scoring: Line performance is scored and reset by shift, giving each crew a comparable target instead of one running daily number
- Shift Handoff Notes: Crews can log notes and context at the end of a shift so the next team starts with a clear picture of what happened
Pros
- Keeps production, communication, and work instructions in one platform
- Production dashboards provide line and shift performance at a glance
- Mobile-first design built for shop-floor use
Cons
- Initial infrastructure setup can be time-consuming to get right
- Data customization for compliance-specific needs adds extra effort
Why we picked this
Redzone is a strong choice for manufacturers who need to combine digital work instructions with workforce training and lean problem-solving tools.
Pricing
Custom pricing depends on the number of sites, production lines, users, and modules you need.
Free trial
Not publicly listed.
5. Augmentir
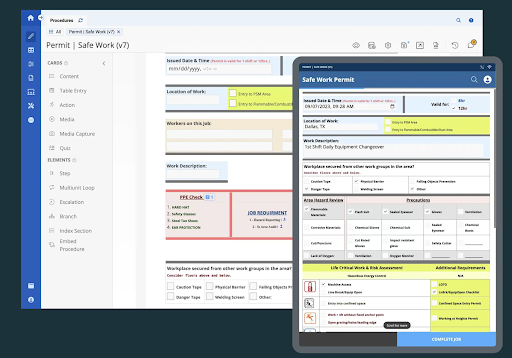
Augmentir is an AI-powered connected worker platform that adapts digital work instructions to an individual worker's proficiency, recency, and certifications. It supports AR-enabled smart glasses in addition to phones and tablets, and layers in remote expert support.
It also includes an Industrial AI Agent Studio for building and deploying custom no-code AI agents across frontline manufacturing workflows.
Key features
- AI-Personalized Guidance: Instructions adapt automatically based on a worker's proficiency, recency, and certifications, rather than delivering the same standard to everyone.
- Remote Expert Support: Live video and AR annotation let an expert guide a worker through a problem from anywhere.
- AR and Wearable Support: Instructions can be delivered through smart glasses in addition to phones and tablets, keeping hands free during the task.
Pros
- Adapts guidance based on operator proficiency and certifications
- Supports AR-enabled devices and remote expert assistance
- Includes tools for building custom industrial AI agents
Cons
- Some users feel the UI and overall design could be more polished
- Reported slowdowns on very large or complex process tasks
Why we picked this
Augmentir is a strong fit for manufacturers that need adaptive instructions, AR support, and AI tools for workers with different skill levels.
Pricing
Not published; enterprise sales process.
Free trial
None publicly listed.
6. Intellect
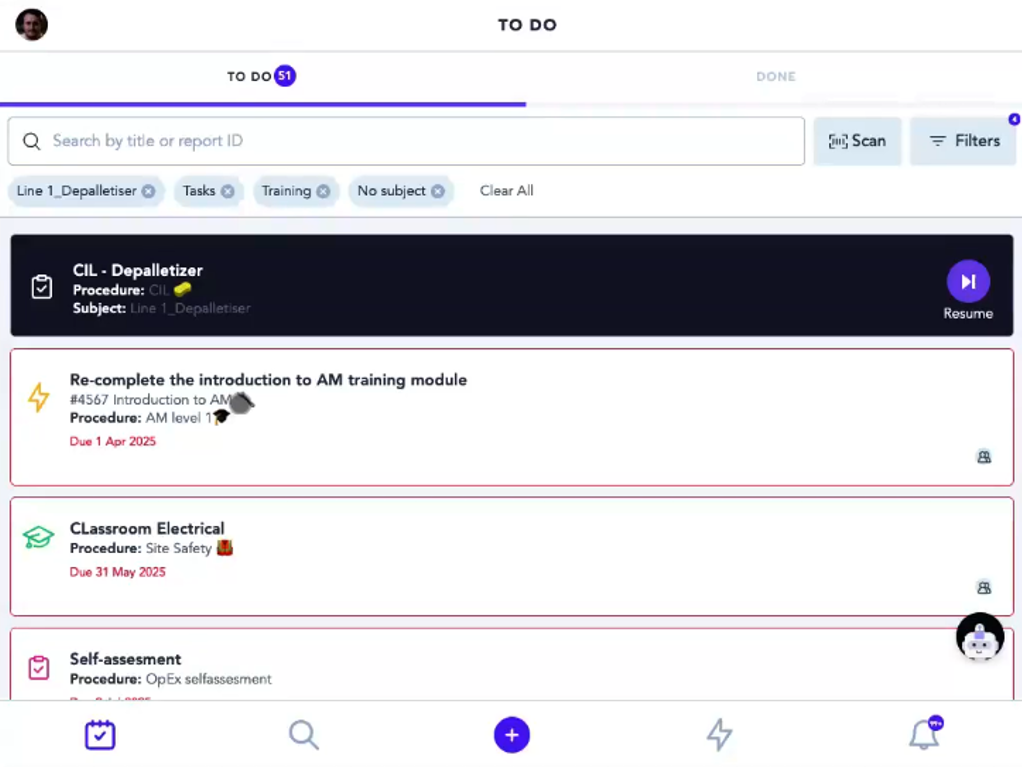
Intellect is an AI-powered quality management system built for FDA, ISO, and GxP compliance, with work instructions as one of 25+ pre-built applications alongside document control, CAPA, and audit management. It's a good fit for pharmaceuticals, medical devices, and other heavily regulated manufacturers.
Key features
- 25+ Pre-Built Applications: CAPA, document control, audits, and employee training all run alongside work instructions in one suite.
- Connected Compliance Records: Document versions, training completions, CAPAs, and audit findings all reference each other automatically, so a logged nonconformance traces back to the procedure version involved and who was trained on it.
- Deep Compliance Tooling: Built-in support for FDA 21 CFR Part 11 and GxP requirements keeps regulated environments audit-ready.
Pros
- Strong regulatory and compliance depth for FDA/ISO/GxP environments
- Broad application suite beyond just work instructions
- Ties document control, training records, and CAPA together natively
Cons
- Requires extensive configuration before the platform is fully ready to use
- User licensing and support fees can climb quickly if opened to the full floor
Why we picked this
Intellect's ISO certification and coverage across aerospace, automotive, medical device, and pharma make it a reasonable shortlist candidate for manufacturers with multiple regulatory frameworks.
Pricing
- Core: Starting at $26,000/year
- Operational Control: Starting at $32,000/year
- Enterprise Transformation: Starting at $47,000/year
- Tailor Your Intellect Platform: Custom pricing
Free trial
Available on request.
7. Dozuki
Dozuki is a manufacturing-specific work instruction platform popular in heavy equipment and pharma/biotech. It's built around reducing changeover times, onboarding time, and labor costs through standardized, well-authored instructions.
It's a focused tool for authoring and training. It's lighter on action-tracking and cross-program analytics. Dozuki is built to get the instruction right and get people trained on it, rather than to be the system that tracks everything that happens after.
Key features
- Digital Document Control: Manage SOPs, work instructions, and one-point lessons with centralized version history and approval workflows.
- In-Line Data Capture: Quality checks are built into the instruction itself, capturing data as the task happens rather than afterwards.
- Standards Training: Training is tied directly to each SOP, so learning and execution live in the same place.
Pros
- Manufacturing-specific with strong traction in heavy equipment and pharma
- Free templates available in PDF, PowerPoint, and Excel formats
- Strong document authoring and standards training tools
Cons
- Reporting is limited in scope and depth
- Lighter on cross-program action tracking than a broader platform
Why we picked this
Dozuki's strongest track record is in heavy equipment and pharma/biotech industries where changeover and onboarding time are measured closely.
Pricing
Available upon request.
Free trial
No free trial for the platform itself; free templates are available separately in PDF, PowerPoint, and Excel formats.
8. Parsable
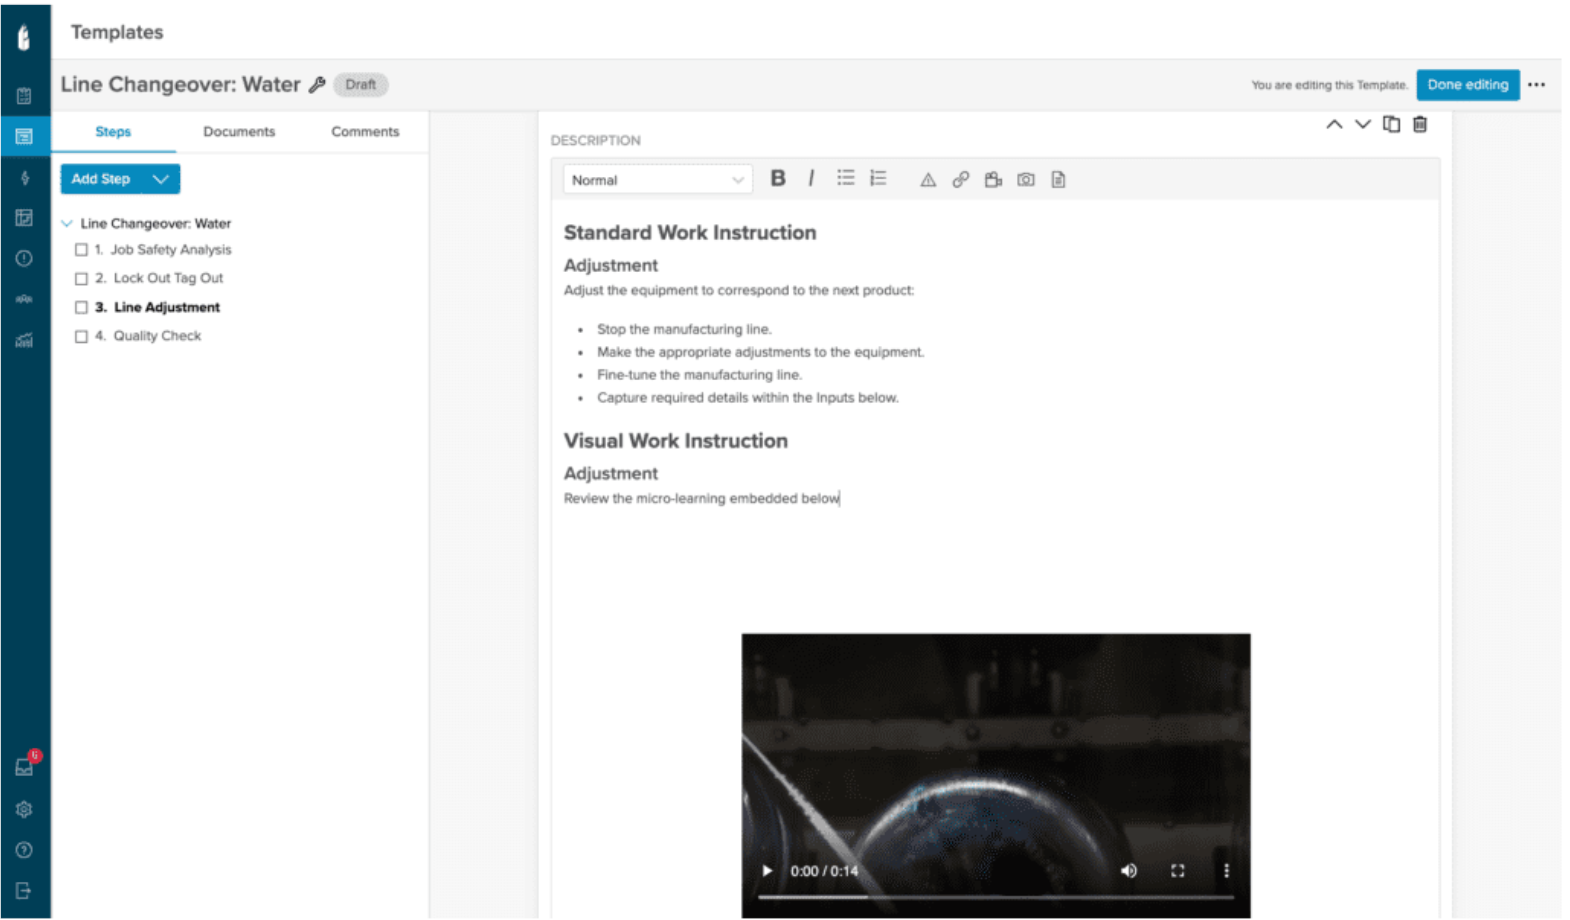
Parsable's Connected Worker platform digitizes paper-based forms, checklists, and SOPs through a no-code web admin portal, producing digital work instructions and one-point lessons. It's built for large industrial organizations, supporting real-time collaboration between frontline workers and remote experts inside the mobile app itself.
The solution is often positioned as one of the stronger options for digitizing complex SOPs with conditional logic and compliance traceability.
Key features
- IoT & Machine Connections: Pull data directly from ERP, MES, CMMS, and IoT-enabled equipment into the instruction itself.
- Real-Time Expert Collaboration: Frontline workers connect with local or remote experts directly inside the app to resolve issues faster.
- In-App Guidance: Provide procedural and training materials within the workflow to support efficient task completion.
Pros
- Strong real-time collaboration between frontline workers and remote experts
- Broad language support across 17+ languages for global operations
- Uses AI analytics to identify trends and anomalies
Cons
- Scheduling capabilities are on the lighter side
- Enterprise-focused setup, with a more complex initial configuration for larger templates
Why we picked this
Parsable is a common name in enterprise industrial settings specifically for its emphasis on remote expert collaboration built into the instruction itself.
Pricing
Not published
Free trial
Parsable has no free trial or free plan, but offers a 30-minute Jump Start Session and a custom demo.
9. Leading 2 Lean (L2L)
L2L's Connected Workforce Platform folds digital work instructions in as one module alongside production, maintenance, and quality tools. Its authoring tool is the same drag-and-drop system formerly known as SwipeGuide.
The company brings dispatch, maintenance, production, and no-code app building (L2L Studio) under one roof. Instructions sit as one piece of that larger system, with pricing quoted case by case.
Key features
- Maintenance Dispatch Integration: Work orders and maintenance tickets link directly to the relevant instruction.
- Training Assignments: Assign instruction-based learning by role, machine, or required skill.
- Live Skills Matrix: Track worker competence on specific machines and processes, tied directly to training and instructions.
Pros
- L2L Execution AI surfaces root causes and recommends next actions
- Reported fast time-to-value, with measurable impact in as little as 16 weeks
- Live skills matrix ties training directly to instruction completion
Cons
- Work instructions and checklists offer limited support for adding text or images to specific fields
- Limited video and media capacity makes it harder to build long-form training modules
Why we picked this
L2L is a strong fit if you want work instructions that also support employee training, skills tracking, and faster onboarding.
Pricing
Custom, quoted based on business needs.
Free trial
Not publicly listed
10. VKS (Visual Knowledge Share)
VKS is a digital work instruction platform that helps manufacturers centralize operational knowledge and guide operators. It supports shop-floor data collection through annotations, signatures, and IoT connections, helping improve instruction adherence and productivity.
Like several other instruction-first tools on this list, its core strength is the instruction and the data capture around it, rather than being the system of record for action tracking.
Key features
- Interactive Annotations: Update templates with visual markups, and push mass updates across instructions at once.
- Guided Visual Instructions: Build step-by-step procedures with images, videos, and visual cues for operators.
- Template Mass Updates: Apply approved changes across multiple instructions without editing each one separately.
Pros
- Shortens operator training time through visual instructions
- Long free trial window: 30 days online plus a 60-day on-site pilot
- Built specifically for manufacturing environments
Cons
- Platform can be complex to adapt to specific business needs
- Editor limits creative control, prioritizing standardized styling over flexibility
Why we picked this
Its extended trial window, 30 days online plus a 60-day on-site pilot, gives manufacturers an unusually long runway to test fit before buying.
Pricing
Available upon request.
Free trial
30-day free online trial plus a 60-day on-site pilot
How to choose the right work instruction software for manufacturing
The following factors help distinguish platforms that improve shop-floor execution from those that primarily digitize existing documents:
1. Configurable without a development team
Your team should be able to create and update standards without submitting an IT request or relying on a developer. This keeps instructions current as processes, equipment, and requirements change.
2. Action tracking, not only instruction delivery
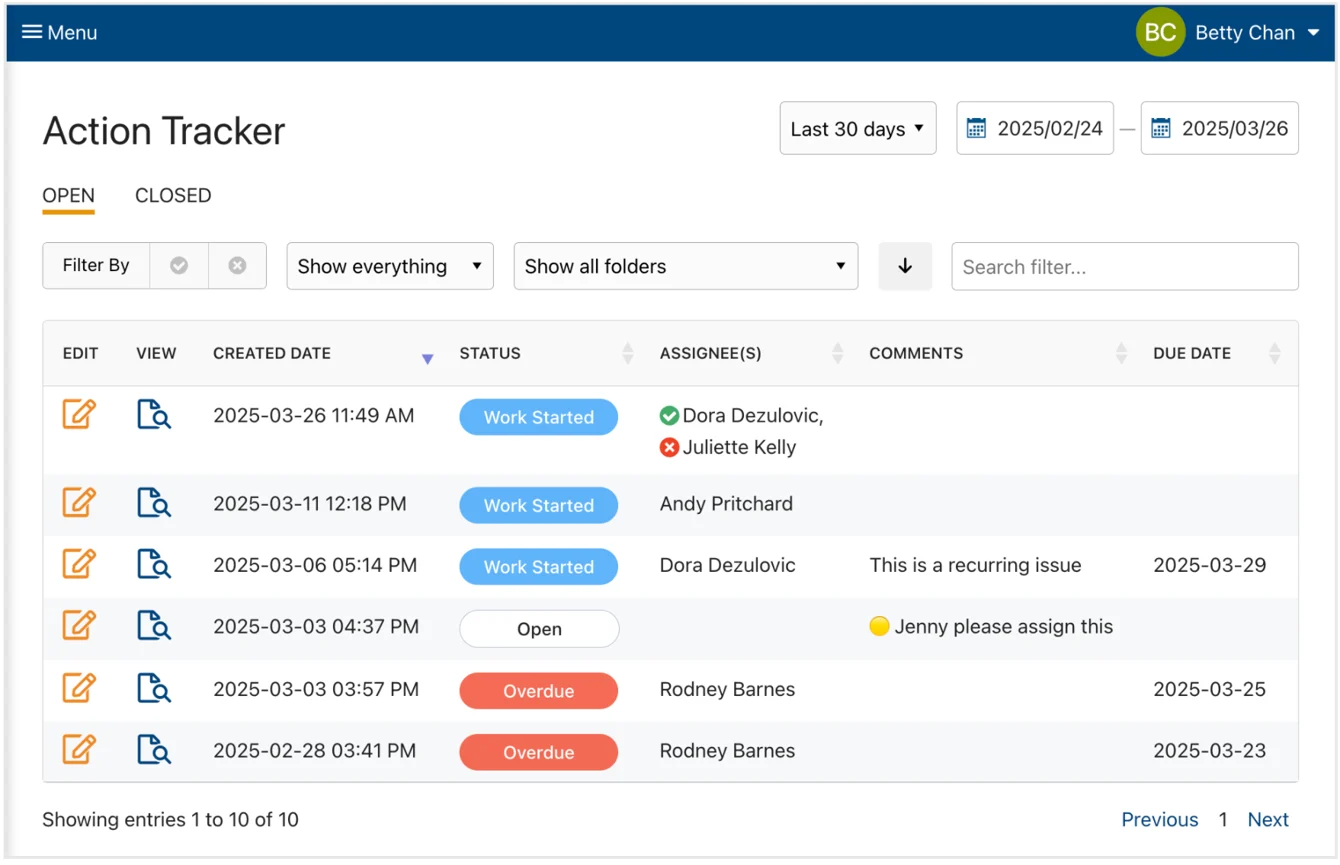
Most platforms support instruction authoring and delivery. Only a few turn a failed step or flagged defect into a tracked action. Check whether the platform can assign an owner, set a due date, send reminders, escalate overdue work, and confirm closure without relying on another system. This is one of the clearest differences between basic work instruction tools and platforms that support closed-loop execution.
3. Built-in evidence capture
Photos, videos, signatures, timestamps, and required fields should be captured within the instruction itself rather than through a separate process. This provides clear evidence that the work was completed and reduces incomplete or inaccurate records.
4. Frontline accessibility
Operators need QR-code access through shared tablets or workstation devices rather than individual accounts. Also consider browser-based access, offline functionality, simple navigation, and multilingual support. These capabilities become especially important when operators share devices, work in areas with limited connectivity, or speak different languages.
5. Integration with existing systems
Decide whether you want work instructions to sit within a broader QMS, OEE, maintenance, or connected worker platform, or operate as a focused tool that connects with your existing systems. Look for reliable integrations with your ERP, CMMS, MES, BI, and SSO setup so instruction data stays connected to the rest of the operation.
6. Pricing model and rollout size
Compare per-user, per-site, and unlimited-user pricing based on how broadly you plan to deploy the platform. Per-user pricing works for limited pilots or smaller teams, but costs rise as access expands across the floor. Site-wide or unlimited-user pricing is often more practical for larger rollouts, although vendors do not always publish pricing upfront.
7. Compliance requirements
Manufacturers in pharmaceuticals, medical devices, and other regulated industries need FDA 21 CFR Part 11 support, GxP controls, audit trails, version control, and electronic signatures. For regulated operations, these compliance requirements should carry more weight than general ease of use or entry-level pricing.
8. Trials and pilots
Use a free trial, pilot, or guided proof of concept to test the platform with real operators, instructions, and workflows before committing. A tool that performs well in a controlled sales demonstration can work differently on a busy production floor, so practical testing is an important part of the selection process.
Find the right work instruction software for your floor
A digital instruction is better than a laminated one taped to a machine. But the instruction itself was never really the hard part; knowing what happened when someone skipped a step is. Most platforms on this list get the instruction right. Few of them close the loop when something goes wrong.
Book a demo to see how Weever connects work instructions to tracked, closed-loop action across every program on your floor.
Frequently asked questions
1. How much does work instruction software cost for a manufacturer?
Pricing varies widely across this list, from free tiers for small teams to enterprise contracts in the tens of thousands per year. Site-wide platforms often price per site rather than per user, while QMS-style platforms tend to run five- and six-figure annual contracts.
2. How long does it take to implement?
Timelines depend on scope. A single-line pilot with a focused instruction tool can go live in weeks. A platform folded into a broader QMS or connected workforce system, with integrations to ERP or SAP, typically takes longer to configure and roll out.
3. Is work instruction software the same as an MES?
No. A manufacturing execution system (MES) manages production scheduling, tracking, and data across the plant. Work instruction software focuses specifically on guiding an operator through a task. Some platforms overlap by combining both, but they solve different problems.
4. Does it require constant Wi-Fi on the shop floor?
Not always. Some platforms are built to work offline and sync data once connectivity is restored, which matters in older facilities or areas with weak signal. This varies by vendor, so it's worth confirming during evaluation.
The Frontline Data Gap: Why Manufacturing Plants Can't See What Happens on the Floor
Ask your maintenance lead why a particular machine fails on nights and you'll get a real answer in about ten seconds. The guard rattles when the humidity's up. That blend runs hot. The Tuesday changeover always slips, and there's a workaround nobody wrote down.
Ask your system the same question and you get a work order and a timestamp.
That distance, between what your plant knows and what it has recorded, is the frontline data gap. Close it and the expertise already walking your floor becomes something you can trend, compare, and act on. Leave it open and that expertise lives in the heads of whoever's on shift, and it leaves when they do.
Below, we break down where the gap comes from, what our 2026 research says about how wide it is, five questions that will tell you whether your plant has one, and the four steps that close it.
What is the frontline data gap?
The frontline data gap is the distance between what your team observes during a shift and what exists as structured, comparable data afterward. The observation happens. It just gets written on paper, described differently each time, or never recorded, so nobody can count it, compare it, or act on it later.
Effort isn't the problem. Operators notice more about a line than any sensor on it.
In Weever's 2026 State of Data Capture in Manufacturing research, a survey of 167 manufacturing leaders at companies with more than 500 employees, 62% said important operational knowledge frequently or very frequently stays only in the experience of their operators and inspectors. Another 31% said it happens occasionally. Just 8% said it rarely happens, and not a single respondent said never. (We ran this research ourselves, so we aren't a neutral party. The full methodology is in the report.)
Put another way, fewer than one plant in ten has this under control.
Why do operator observations never make it into a report?
There are three reasons, and none of them come down to people not caring.
- The form never asked. The round sheet has a box for the reading and no box for the reason. An operator who adjusts a filler and rechecks it has done the job right, but there's nowhere to note that the seal looked worn. That observation exists for about four minutes, then it's gone.
- It didn't feel like an event. A four-minute fix feels like part of running the line, so nobody logs it. Repeat that across a crew for a few weeks and you get dozens of interventions on one machine that were never recorded as the same thing, if they were recorded at all.
- Logging it takes longer than fixing it. If writing up the observation takes two minutes and the fix took four, the paperwork is the expensive part. People make that trade every shift, in every plant, and it's a rational one.
How much of manufacturing still runs on paper?
More than most leaders assume, and it's concentrated in the programs that carry the most risk.
Our research found that 66% of quality programs and 63% of safety programs rely primarily on paper, spreadsheets, or homegrown tools, along with 41% of autonomous maintenance and 29% of sanitation programs. Two thirds of respondents run at least two frontline programs this way. Only 10% run none of them.
Quality and safety are the two programs most likely to be audited, most likely to trigger a recall or a recordable, and most likely to draw the hardest questions anyone asks you.
These aren't plants that are behind on technology, either. A 2024 survey by the Manufacturing Leadership Council, the digital transformation arm of the National Association of Manufacturers, found 70% of manufacturers still collect data manually. Those plants have ERPs, historians, and CMMS (computerized maintenance management system) platforms. The software just never made it to the floor.
When we asked leaders to name the single biggest factor hurting frontline data quality, manual and paper-based processes came first at 36%. Disconnected systems followed at 26%, then lack of standardized processes at 19%. Inconsistent software adoption came last among operational causes at 10%.
Leaders aren't blaming their people or their training budget. They're pointing at how the data gets captured.
Paper vs. structured digital capture: what actually changes?
Paper's real limit is that it can't produce a dataset. Here's how the two approaches compare on the things that decide whether frontline data is usable.
Why do leaders trust data that has obvious gaps?
This is the result from our research that surprised us most.
84% of the leaders surveyed said their frontline operational data is trustworthy enough to support AI. Of those confident leaders, 90% also reported at least one condition that undermines it: knowledge that stays in operators' heads, the same issue logged differently depending on who's on shift, or manual processes they themselves say block AI-readiness.
Both answers are honest. Our read is that more data isn't the same as more answers. A plant can go from two hundred completed checklists a month to two thousand, and every one of them can say the same thing: check complete, no issues found. The volume grew tenfold. The number of recorded reasons behind anything that happened stayed flat.
Volume shows up on every dashboard, while missing context shows up nowhere. So leaders end up grading their data on the half they can see.
Why does inconsistent logging hide recurring failures?
Because entries that describe the same problem in different words never get counted together. Capturing data is half the job. Capturing it the same way every time is the other half, and it decides whether a thousand entries can be counted as a set.
51% of leaders in our survey said the same issue is frequently or very frequently recorded differently depending on the person or shift logging it. Another 35% said occasionally. Only 14% said rarely or never.
On paper, or in a spreadsheet with a free-text field, that's close to inevitable. One operator writes "leak." Another writes "seal weeping." A third writes "minor drip, monitored." All three describe the same failure, and none of them will ever be counted together.
A worked example: one filler head, six weeks, four systems
This is a composite example, but most plant managers will recognise it.
Line 3 runs 500 mL sauce bottles. Fill weights drift light on head 6. An operator adjusts the timing, rechecks a few bottles, and keeps running. Four minutes. It happens roughly forty more times over six weeks, across eleven operators.
One entry has real context: head 6 light, about 4 g under, increased fill timing, rechecked in spec, seal looks worn. One entry says "adjusted filler," timestamped and unusable. Most were never logged. The ones that were landed in different places: a quality deviation here, a downtime code there, a line in a handover note.
Eighteen months later, a reliability engineer asks how often head 6 has needed intervention. The answer is scattered across four systems and mostly unwritten, so the recurring failure never shows up as recurring.
The worn seal is still in the machine.
There's a slower cost underneath this one. When leaders review data they know is inconsistent, they discount it. When operators see their entries discounted, they put less into them. The data gets worse, which justifies discounting it further. Very few plants can point to the moment that cycle started.
How do you know if your plant has a frontline data gap?
Answer each of these questions honestly and you will know within about two minutes.
- How many times was a specific asset flagged for the same issue in the last six months? If answering means someone has to go read binders, you can't count it, and if you can't count it you can't see it.
- What's your corrective action closure rate this month, and how old is the oldest open one? If nobody knows, actions are being opened and not tracked.
- Is your task completion rate broken out by shift? A plant-wide 94% can easily be 99% on days and 78% on nights. The average hides the only number worth acting on.
- When an operator reports something, how long until it has an owner? Measure it in hours, not intentions.
- How long would it take to produce twelve months of sanitation records for one line? If the answer is a week, that's the same gap showing up as audit exposure.
Why does the frontline data gap matter more now that plants are using AI?
Because the systems reading your data have changed, and they fail differently.
A dashboard built on incomplete frontline data looks incomplete. Somebody notices the blank column and goes looking for the answer.
AI handles one kind of gap well. A check that was scheduled and never completed is a clean anomaly, and a well-built system will flag it. The harder gap is the work nobody scheduled. Those forty filler adjustments were never on a schedule, and no field asked why a filler was adjusted, so there's no hole to find. There was never a slot to be empty.
And the timing is now. 83% of the organizations in our survey are already deploying or piloting AI in manufacturing operations, and half are deploying across production now. Whatever state your frontline data is in today is the state AI is reasoning from today.
Leaders know it. 77% agree that manual or paper-based processes prevent frontline data from being AI-ready, and 73% say limited trust in frontline data is already preventing their organization from relying on AI.
The investment is being made. The reliance is being held back.
How do you close the frontline data gap?
Start with one process on one line, digitized, with the loop closed. You don't need a transformation program. Work through these four steps in order, because each one depends on the one before it.
1. Make capture something operators will actually do
If the tool is harder than the paper it replaces, the data won't exist. Treat this as the first requirement rather than a change management task for later. Most forms fail here before an operator ever sees them, because nobody asked which fields belong on them. A sixty-field form isn't more rigorous than a twelve-field form. It's a twelve-field form with forty-eight fields filled in from memory.
2. Structure it so the data stays consistent
Free text is where consistency breaks down. Defined fields, evidence attached at the step, and one set of conventions across programs are what turn a thousand observations into a dataset.
3. Close the loop so people keep reporting
Every issue needs an owner, a due date, and tracked closure. That's accountability, and it's also the only reliable way to keep capture going. When operators see their observations lead to changes, they keep reporting. When they don't, capture quality drops off fast, and no policy memo brings it back.
4. Connect it and keep it portable
If the data can only be read inside the tool that captured it, it can't feed your BI stack, your enterprise systems, or any AI you plan to rely on.
Plants that work through this in order see the picture change quickly. Adient, an automotive seating manufacturer we worked with, went from more than 60 open issues a month to fewer than 5 and lifted its 5S score from 85% to 97%, going fully paperless in under three months.
Why manufacturers choose Weever
Capture at the source
Operators complete forms at the machine on a phone or tablet, faster than the clipboard they replace. At Mars Yorkville, quality checks run 400% faster.
Structure that makes data countable
Defined fields and one set of conventions across every program, so forty observations of the same failure get counted as forty observations of the same failure.
A loop that closes
Every finding gets an owner, a due date, and tracked closure, which is what keeps people reporting in month six. Royal Canin reached a 95% corrective action close rate.
AI that reads what your floor captures
Weever Radar, our AI operational intelligence layer, works across the quality, safety, maintenance, and sanitation data your teams already capture in Weever, so recurring patterns surface without anyone reading binders. [CONFIRM WORDING WITH PRODUCT]
Data that stays yours
Structured, exportable, and portable into your BI stack and enterprise systems.
The knowledge was never hidden. Walk any plant and you'll find the person who knows why the machine fails on nights. They'll tell you in ten seconds.
Nobody ever gave them thirty seconds and somewhere to put it.
Want to see what your plant isn't capturing today? Book a demo and we'll walk through one of your own processes in Weever.
Frequently asked questions
What is the frontline data gap in manufacturing?
The frontline data gap is the distance between what frontline teams observe during a shift and what exists afterward as structured, comparable data. Observations happen, but they're written on paper, described inconsistently, or never recorded, so they never become something a plant can count, trend, or act on.
How many manufacturers still use paper for frontline programs?
Weever's 2026 State of Data Capture research found 66% of quality programs and 63% of safety programs still rely primarily on paper, spreadsheets, or homegrown tools. Separately, a 2024 Manufacturing Leadership Council survey found 70% of manufacturers still collect data manually.
Why does operational knowledge stay with operators instead of in systems?
Because most forms ask for readings, not reasons. There's usually nowhere to record why something was adjusted, small fixes don't feel like events worth logging, and writing up an observation often takes longer than resolving it. Operators make that trade rationally, every shift.
Is inconsistent data a problem if everything gets logged?
Yes. If three people describe the same failure as "leak," "seal weeping," and "minor drip," those entries are never counted together. The recurring problem never surfaces as recurring, which defeats the purpose of capturing it. In Weever's research, 51% of leaders say this happens frequently or very frequently.
How does the frontline data gap affect AI in manufacturing?
AI can flag a scheduled check that was never completed. It can't flag an observation your forms never asked for, because that absence leaves no trace. In Weever's 2026 research, 73% of leaders say limited trust in frontline data already prevents their organization from relying on AI.
How do I know if my plant has a frontline data gap?
Try to answer three questions: how many times one asset was flagged for the same issue in six months, what your corrective action closure rate is this month, and how long it would take to produce twelve months of records for one line. If any answer requires reading binders, the gap is there.
Where should a plant start closing the frontline data gap?
Start with one program on one line, and digitize the process you already run before redesigning it. Prioritize the program with the most paper and the highest audit exposure, which in most food and beverage plants is quality or sanitation.
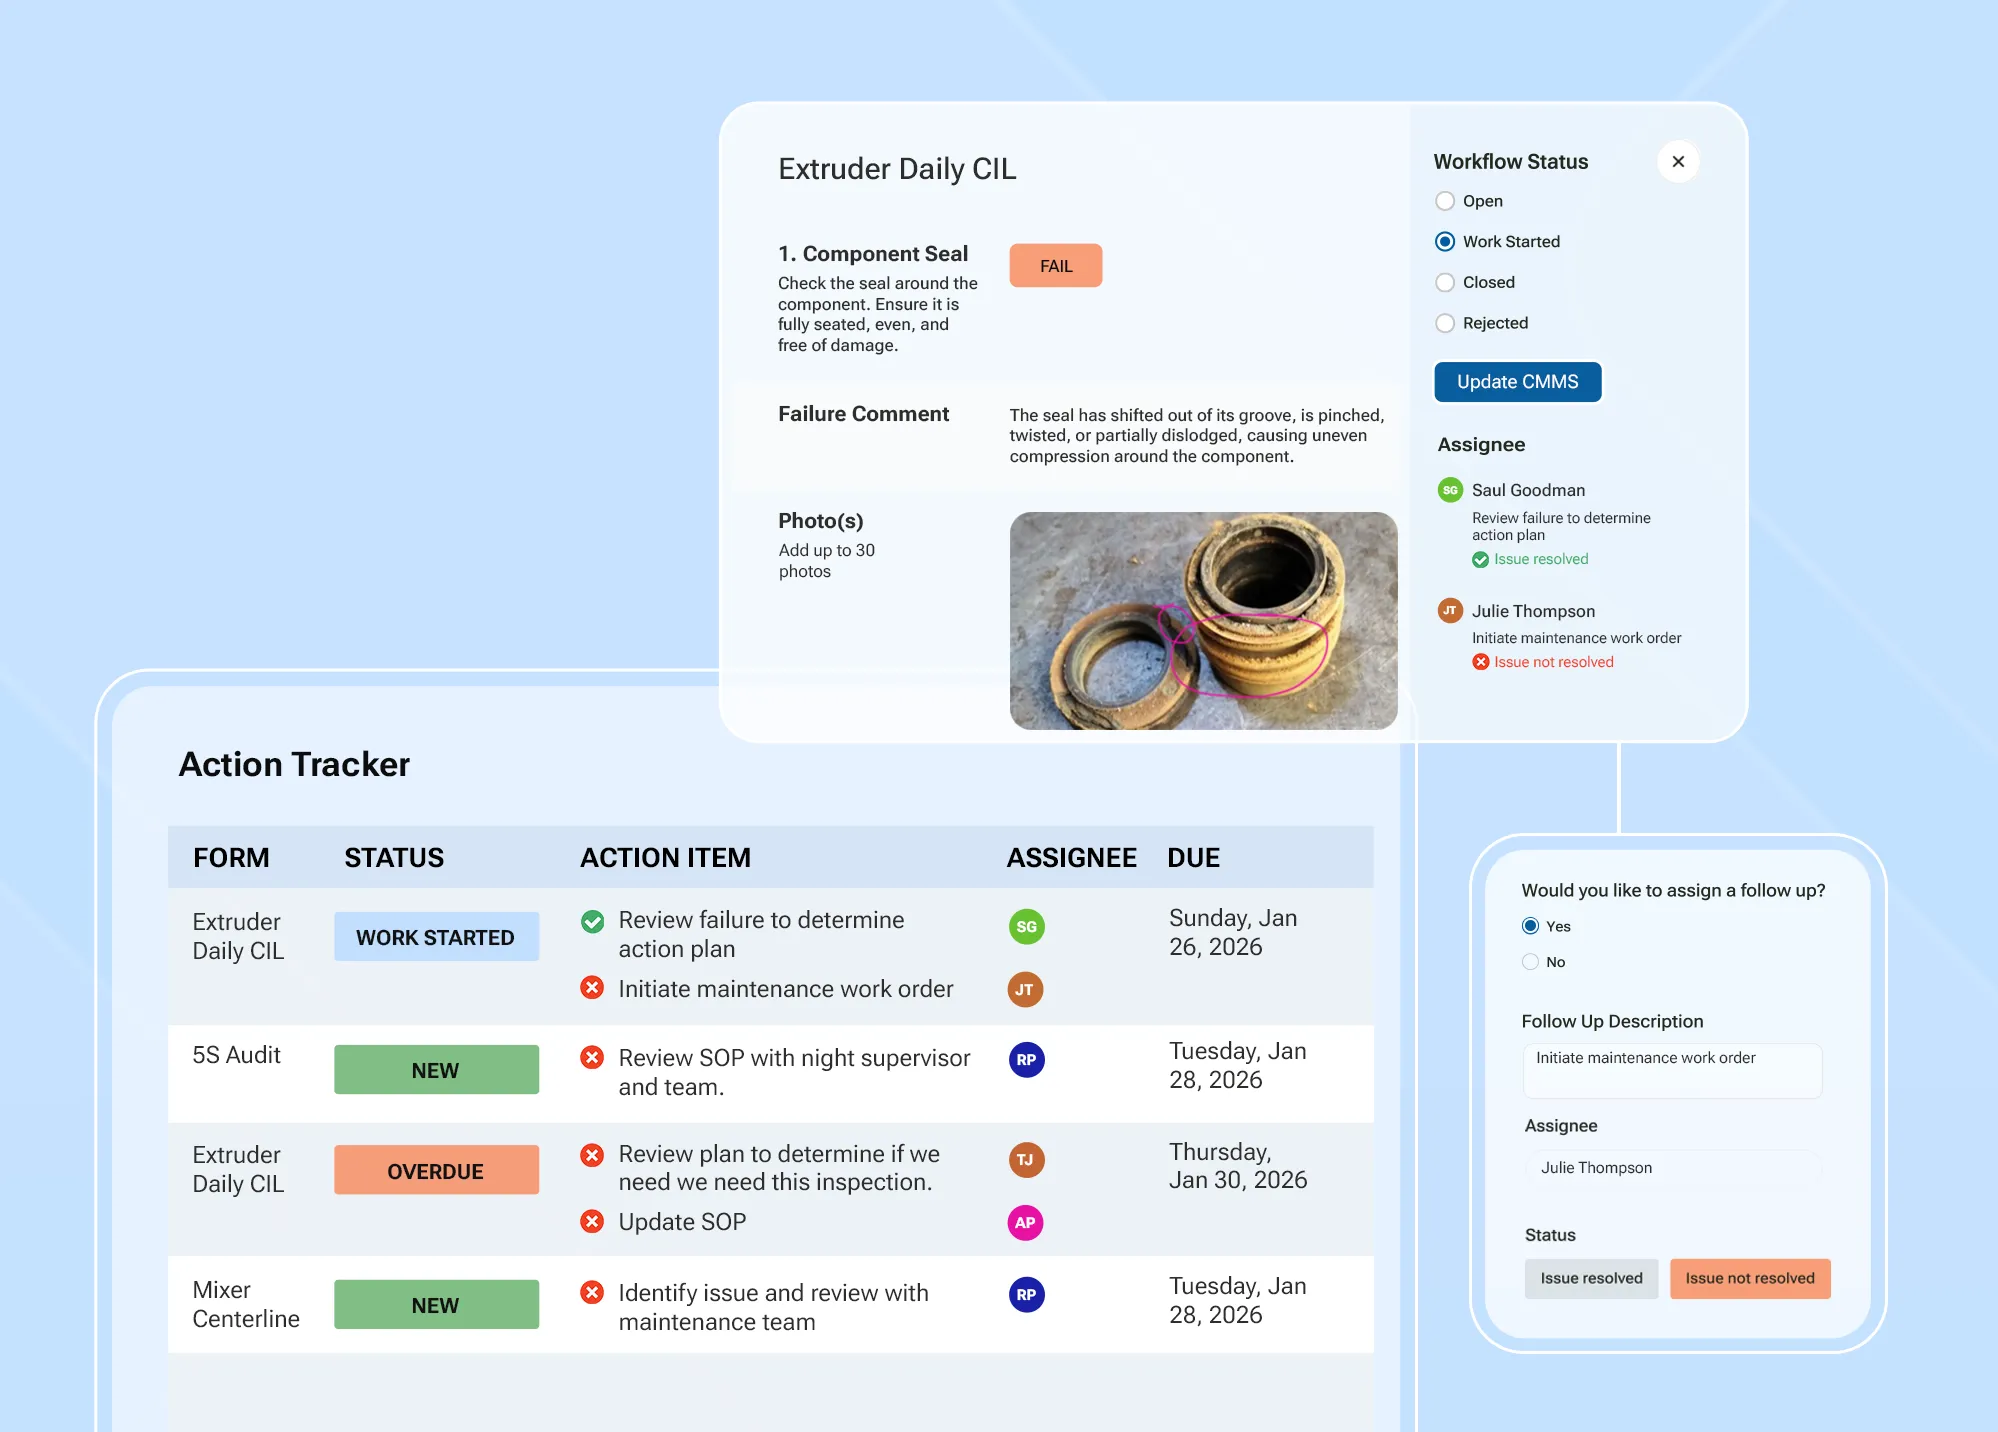
The 7 Critical Steps in Building an Autonomous Maintenance Checklist
Today’s business environment is challenging: more competition, higher costs, slimmer margins. That means that reliability and efficiency are more crucial than ever.
Downtime can disrupt entire manufacturing operations and supply chains, making it essential for you to find smarter ways to keep machinery running at peak performance. Taking a proactive approach to autonomous maintenance, a key component of Total Productive Maintenance (TPM), empowers your operators to take ownership of routine tasks like cleaning, inspecting, and monitoring their equipment. This results in faster issue detection, fewer breakdowns, and greater operator engagement.
By automating workflows, capturing real-time insights, and continuously updating processes, the checklists you can build with Weever ensure that maintenance not only keeps up with the pace of business, but stays ahead. The magic lies in creating a dynamic autonomous maintenance checklist tailored to your business needs.
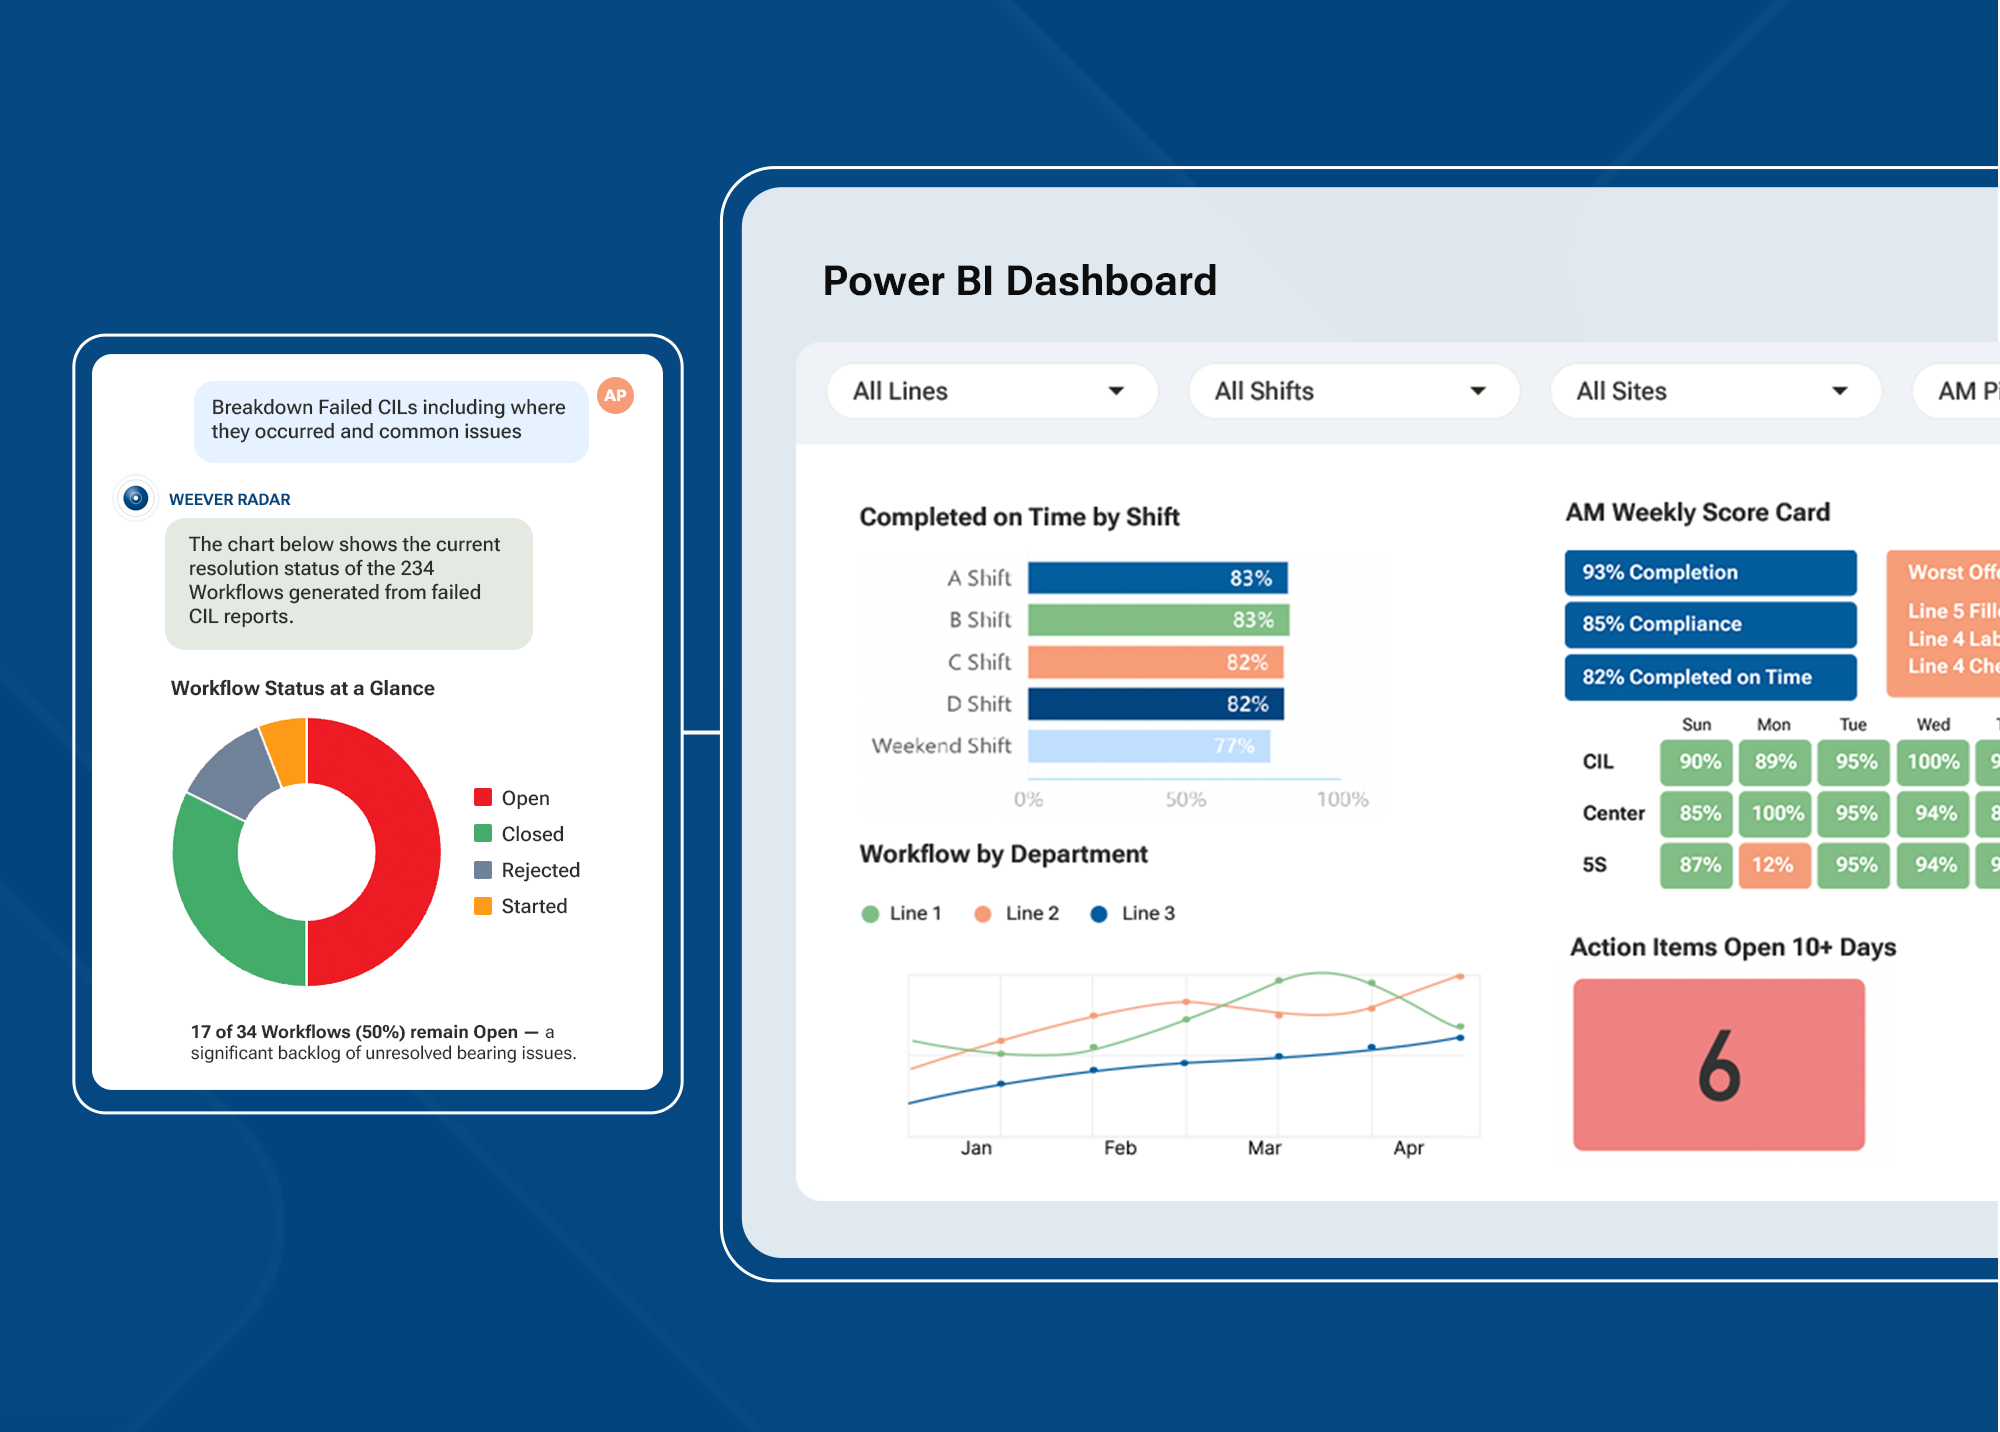
Let’s walk through the seven essential steps required to build an effective autonomous maintenance checklist:
Step 1: Start with Initial Cleaning
- Task: Thoroughly clean equipment to remove contaminants such as dust, dirt, oil, and grease.
- Purpose: This “deep clean” serves two functions. First, it exposes hidden issues such as leaks, cracks, and loose fittings, that operators might miss otherwise. Second, it builds familiarity. Operators who clean equipment thoroughly often notice subtle changes in condition before they turn into breakdowns.
Weever’s Role: Weever makes this stage easy to manage by standardizing cleaning protocols and scheduling reminders. Operators know exactly what’s expected, while managers gain visibility into when and how thoroughly each task is completed. Consistency is no longer dependent on a worker’s memory or paper checklists; it’s baked into the system, providing consistency and reliability.
Step 2: Eliminate Sources of Contamination
- Task: Identify and remove what causes recontamination. That might mean fixing oil leaks, sealing gaps, or improving shop-floor cleanliness.
- Purpose: Cleaning is only effective if it lasts. Tackling root causes extends the life of equipment and reduces wasted time on repeated cleanings.
Weever’s Role: Automated workflows in Weever assign corrective actions and send reminders so that contamination sources aren’t just observed but acted upon. By embedding accountability into the process, issues are addressed proactively, long before they degrade performance. The result: savings of time and money.
Step 3: Establish CIL Standards (Clean, Inspect, Lubricate)
- Task: Define standardized procedures for cleaning, inspecting, and lubricating each piece of equipment. Include the right tools, materials, and frequency.
- Purpose: Standardization reduces variability. Without it, maintenance quality depends on who’s on shift that day. Clear standards ensure reliability and repeatability.
Weever’s Role: With Weever, businesses can digitize and continuously refine their CIL standards. Updating and sharing a digital checklist takes minutes, ensuring that new best practices and technologies are incorporated seamlessly across teams and facilities.
Step 4: Conduct General Inspections
- Task: Schedule regular inspections to spot abnormalities such as strange vibrations, odd noises, overheating, or unusual smells.
- Purpose: These simple checks catch small problems before they spiral into costly failures. Early detection is one of the most powerful tools in preventive maintenance.
Weever’s Role: Weever automates scheduling and logs every completed inspection. Missed checks trigger real-time alerts, while anomalies are tracked, assigned, and resolved within the same system. Nothing is allowed to slip through the cracks.
Step 5: Empower Autonomous Inspections
Task: Train operators to conduct detailed inspections using specialized tools and techniques.- Purpose: Operators are closest to the equipment. When they have both knowledge and responsibility, they’re more likely to notice misalignments, wear, or small defects before anyone else. This strengthens ownership and keeps machines running longer.
Weever’s Role: Weever provides mobile digital checklists and inspection guides that operators can access on the floor. It also integrates with IoT devices to capture real-time data (temperature, vibration, pressure) automatically. That means less paperwork, more accuracy, and quicker insights.
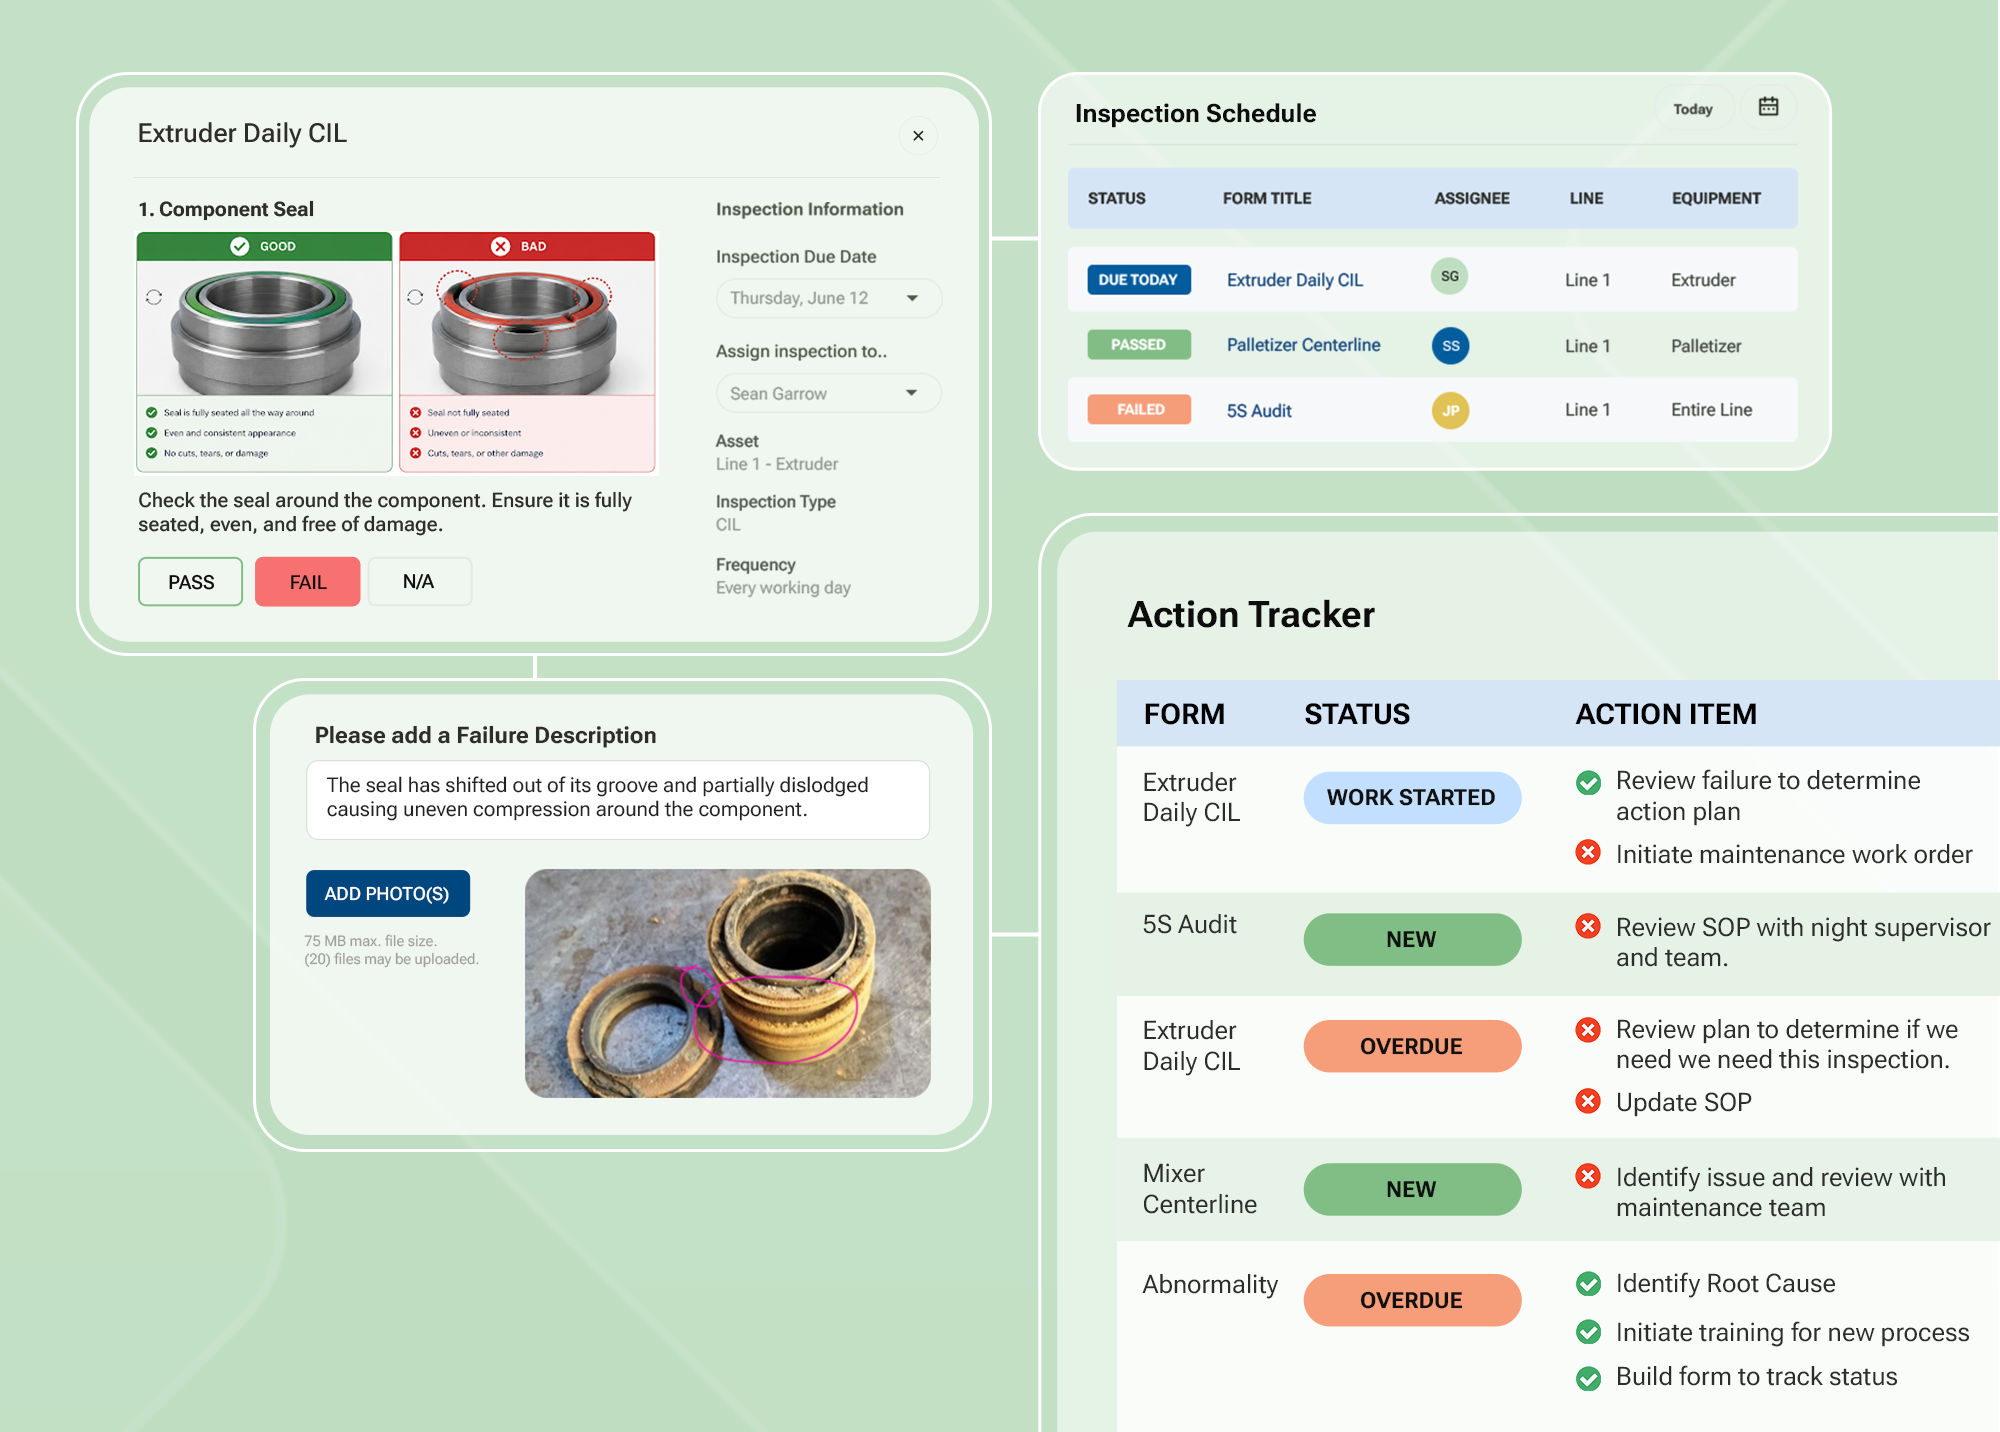
Step 6: Standardize and Share Best Practices
- Task: Document every procedure, inspection, and maintenance task so that the best way becomes the only way.
- Purpose: Consistency across shifts, teams, and plants ensures that everyone follows the same high standards. Standardization also reduces training time and makes onboarding smoother.
Weever’s Role: Weever becomes a living knowledge base and the cornerstone of your autonomous maintenance program. Best practices are stored digitally, updated instantly, and shared across the organization. As equipment, technologies, and regulations evolve, the documentation evolves with them.
Step 7: Commit to Continuous Improvement
- Task: Review performance data, operator feedback, and industry trends to refine checklists regularly.
- Purpose: Autonomous maintenance isn’t static. It should evolve alongside advances in sensors, lubricants, or safety standards. Continuous improvement ensures your checklist remains relevant and effective.
Weever’s Role: This is where Weever shines. Its analytics and reporting tools uncover inefficiencies and improvement opportunities. Managers can see which tasks prevent downtime most effectively, where bottlenecks exist that slow operators, and which emerging best practices should be adopted.

How Weever Helps Businesses Stay Ahead
Building a checklist is the foundation of your autonomous maintenance program. Keeping it relevant is the real challenge. Industrial maintenance is evolving fast, with IoT sensors, AI-driven analytics, and predictive maintenance models changing how companies operate. Here’s how Weever ensures your checklist never falls behind.
- Ease of Use - Weever’s intuitive design allows both managers and operators to make updates quickly. When new trends or methods emerge, they can be folded into existing workflows without confusion or downtime.
- Automated Workflows - Routine tasks no longer clog schedules. Weever automates reminders, follow-ups, and escalations. That means operators spend less time managing paperwork and more time executing tasks that matter.
- Actionable Insights - Weever’s data analytics give businesses real-time knowledge of equipment health. Instead of waiting for something to break, companies can predict and prevent failures by spotting trends in inspection data. And you know what that means? Less downtime?
- Real-Time Reporting - Maintenance leaders can see the current state of every checklist across sites. If a task is overdue or a new standard isn’t being followed, they’ll know instantly. This agility keeps operations running smoothly.
- Smooth Rollouts - When it’s time to adopt a new trend such as vibration sensors or a novel lubrication method, Weever provides a structured rollout. Tasks, training, and documentation are integrated into existing workflows without disruption.
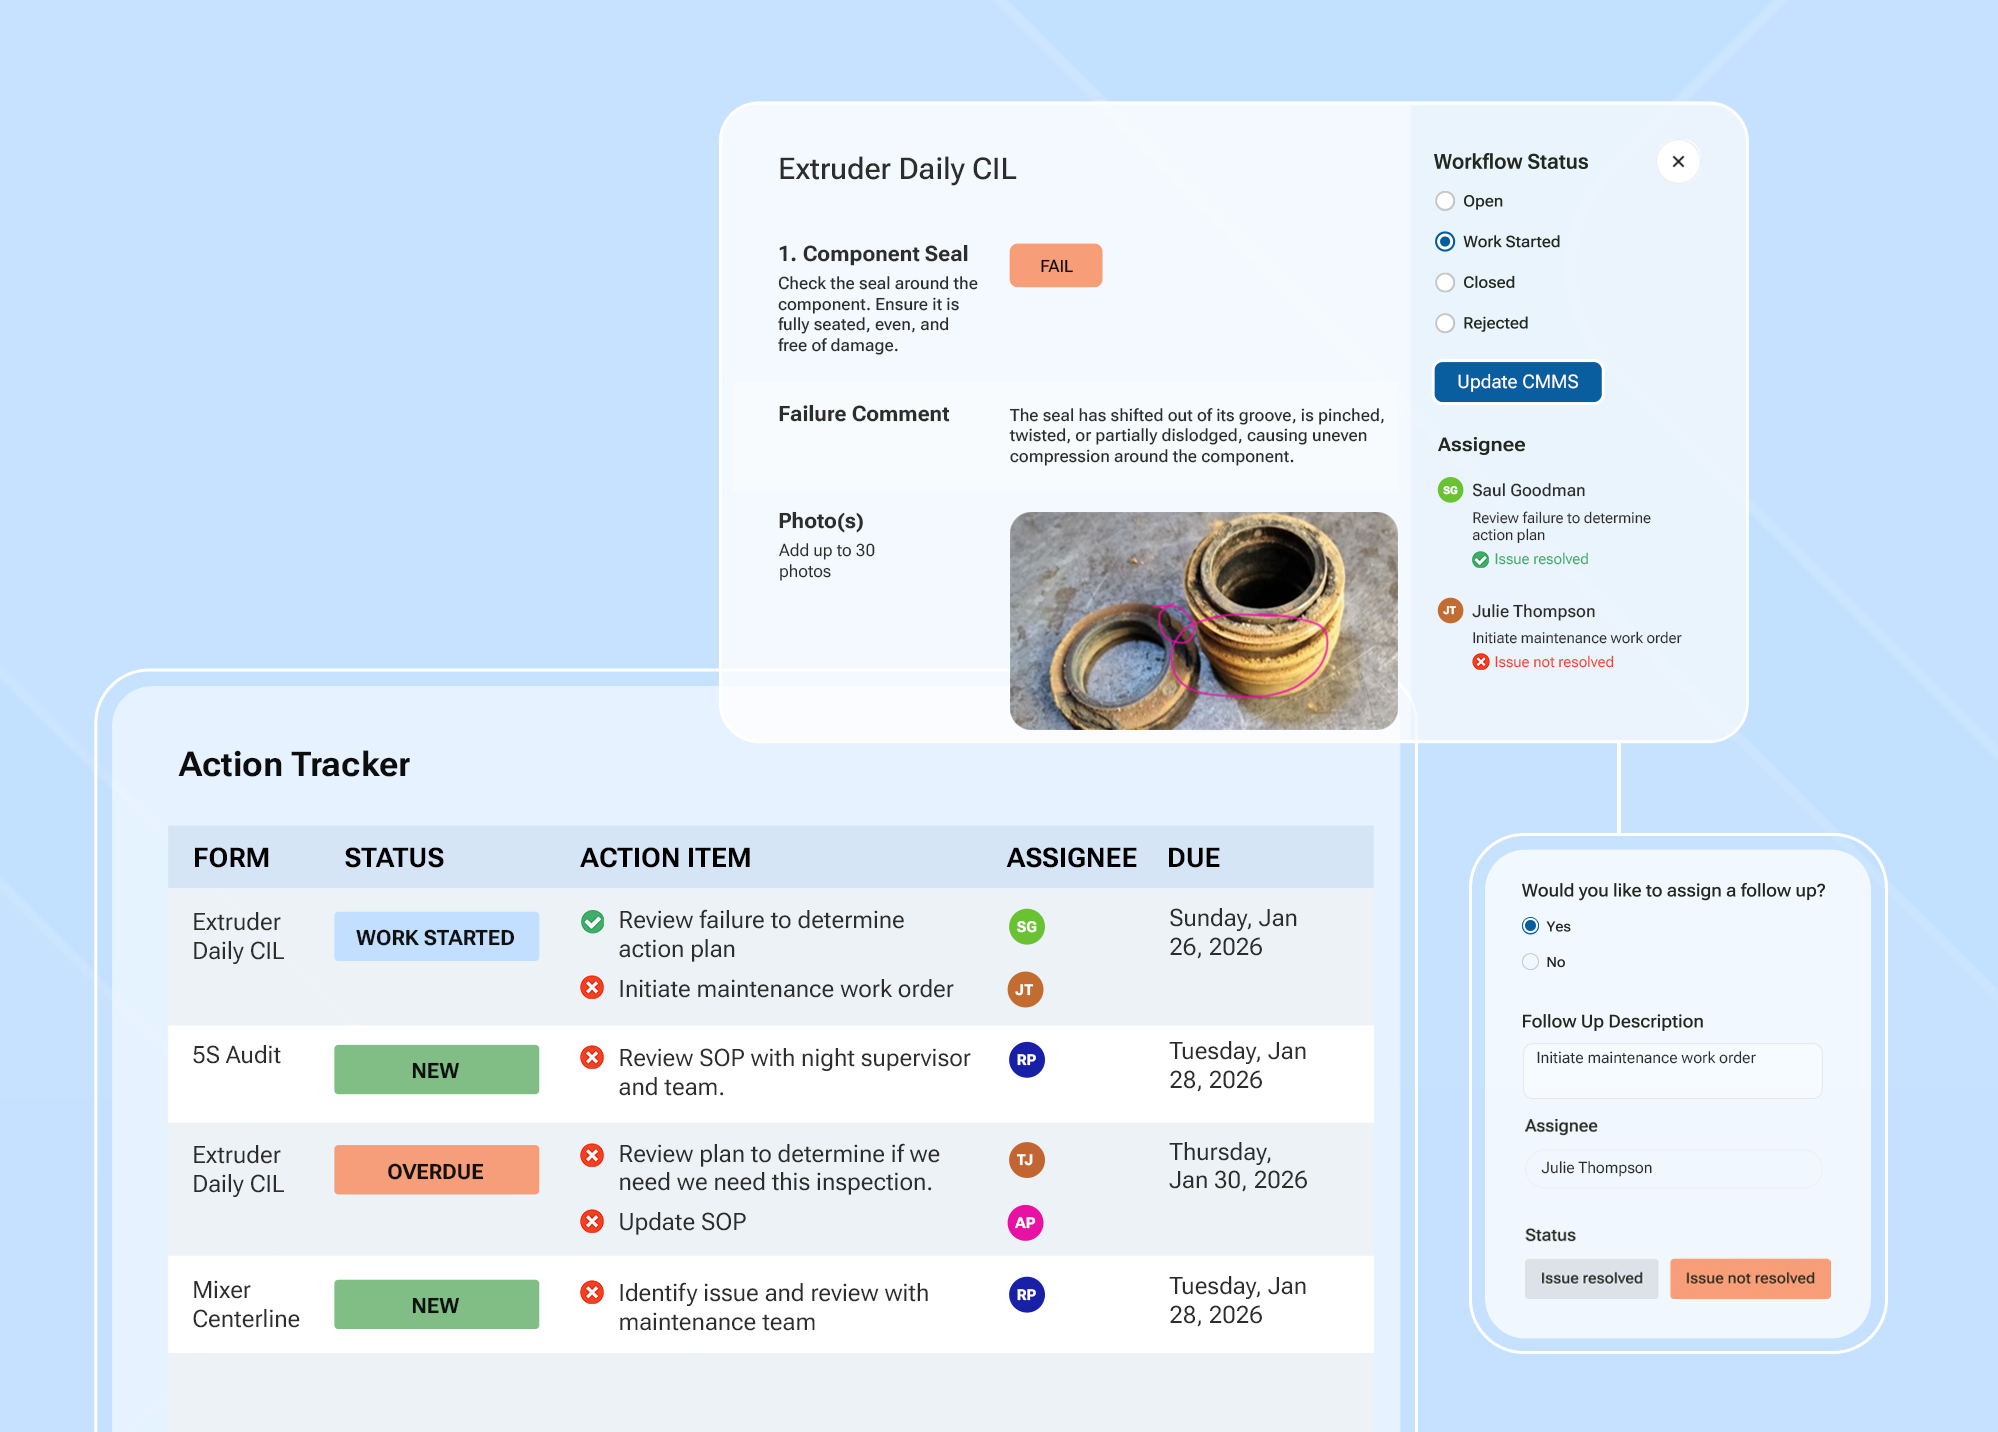
An Evolving Checklist for the Future
Historically, paper checklists were a static “to-do” list. An autonomous maintenance checklist is a living system that changes with your equipment and processes, extending equipment life, empowering operators, and keeping businesses competitive in a landscape where downtime is unacceptable.
Emerging technologies and industry best practices evolve constantly. With Weever, you aren’t just building a checklist. You are building a framework that adapts, improves, and scales to fit your needs.
Do you want a checklist that asks the same questions over and over, or do you want one that allows for all kinds of input, helping to create a culture of reliability and continuous improvement?
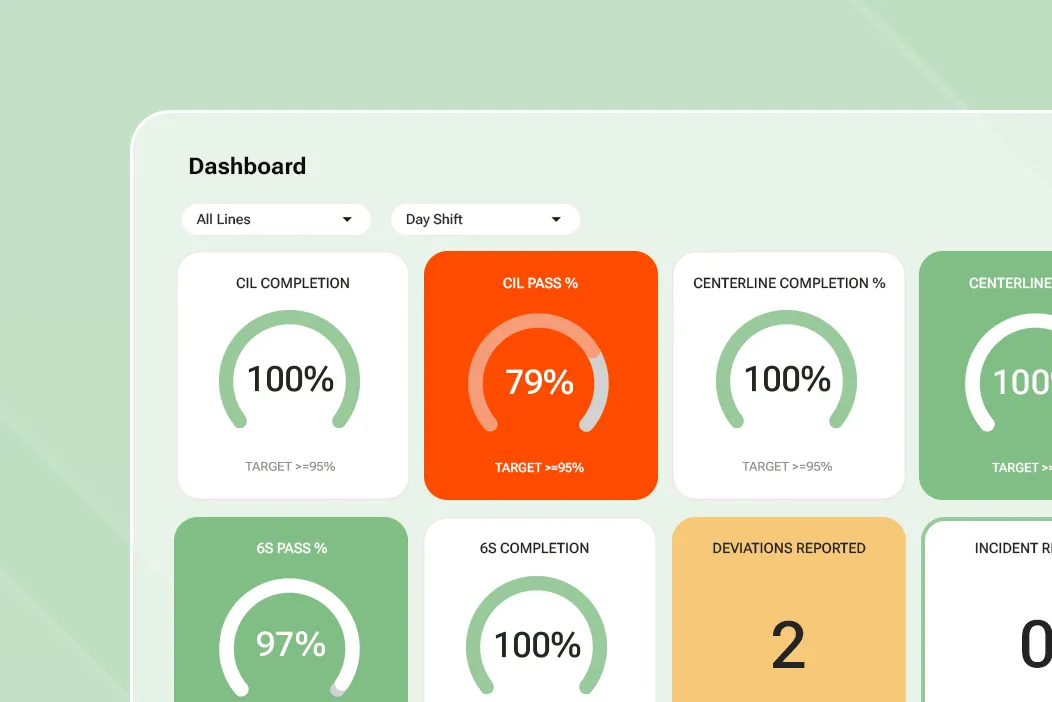
How to Optimize Autonomous Maintenance in Manufacturing with Weever
If you're running an Autonomous Maintenance program, you already know how it works. Operators clean, inspect, and lubricate (CIL) their own equipment. They catch abnormalities before they become breakdowns, centerline equipment and perform 5S audits. As a result, technicians get freed up for planned, higher-value work and operators become more engaged and productive.
The theory is solid. The execution is usually where it falls apart.
CILs get pencil-whipped at the end of a shift. Centerline readings get logged from memory instead of the gauge. Abnormality reports go into a binder nobody opens again. Your completion report says 100%, but a quick walk around the floor tells another story.
Done right, AM is one of the highest-ROI programs a plant can run. Done on paper, it stalls out within a year, one more binder gathering dust in the maintenance office. The difference isn't effort. It's whether the system your team uses actually captures what's happening, acts on it, and turns it into something you can learn from.
That's the loop we'll walk through here: Capture, Act, Analyze. It's the same cycle underneath every Weever program, and it's what turns AM from a checklist exercise into a program that enables continuous improvement and actually moves OEE (Overall Equipment Effectiveness).
What Is the Weever Loop and Why Does AM Need It?
Most AM programs break at the same three points. Data gets captured, but nobody trusts it. Issues get reported, but they don't get resolved. And even when the data is accurate and the issues do get closed, it's scattered across paper logs, spreadsheets, and tribal knowledge, so nobody can see the pattern until it's already cost you a line.
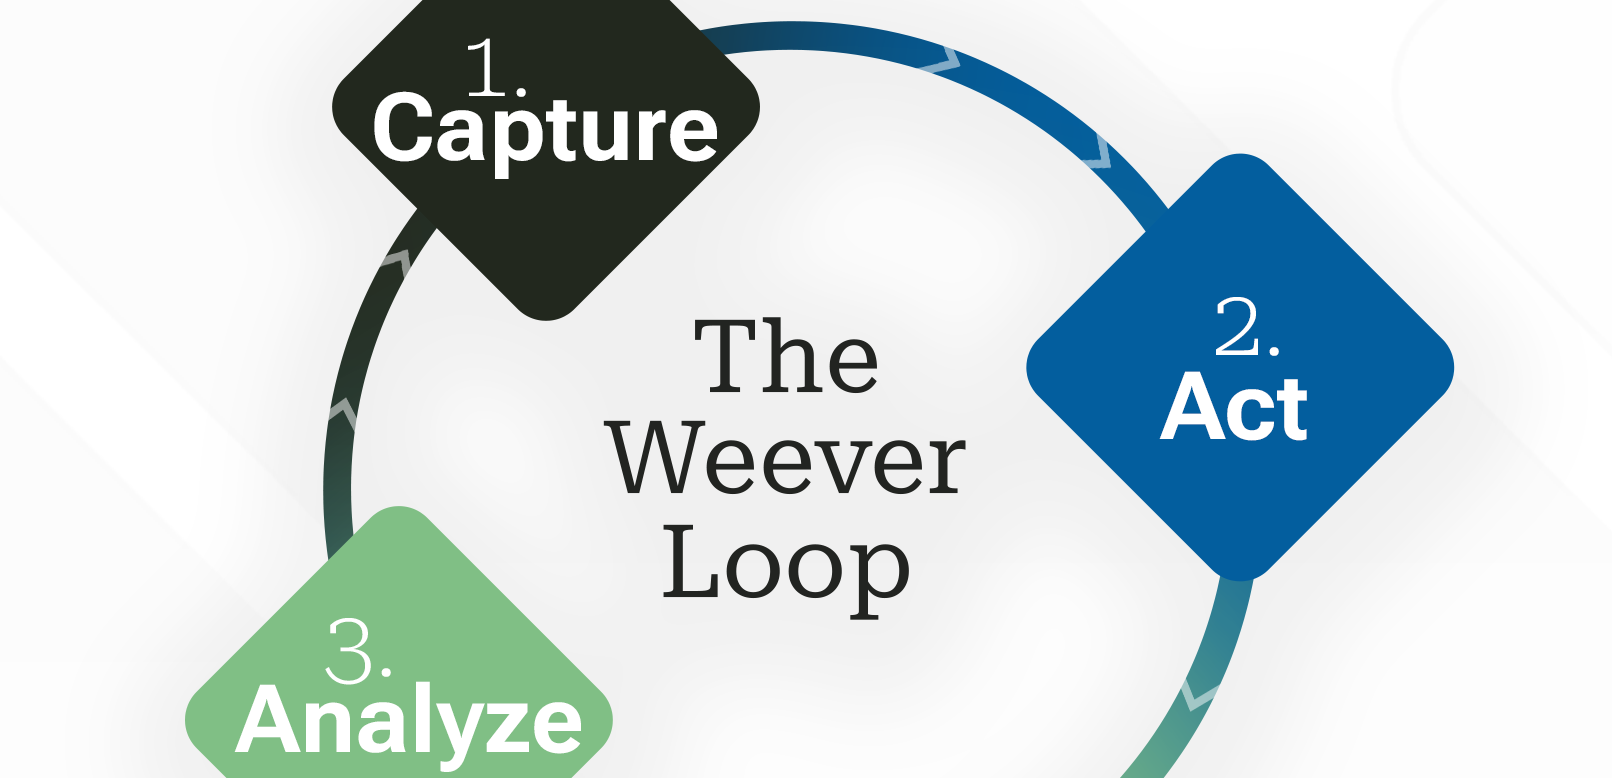
Weever runs AM as a loop instead of three disconnected steps:
- Capture the right check, from the right operator, with evidence, so the data is trustworthy from the moment it's collected.
- Act on every issue with an owner, a due date, and follow-through tracked to closure, so problems actually get fixed instead of logged and forgotten.
- Analyze the data that builds up across every line, shift, and site, so you can see what's driving your downtime and catch the next issue before it happens.
Each stage feeds the next. A completed CIL becomes a data point. A resolved abnormality becomes a pattern. A pattern becomes a prediction. Run the loop consistently and your AM program compounds. Skip a stage, and you're back to paper with better fonts.
1. Capture
Getting Trustworthy Data From the People Who Run the Machines
The hardest part of AM has never been getting operators to do the check. It's getting a version of the check that fits how your plant actually runs, getting it scheduled so it actually happens, and making sure the person doing it knows exactly what "correct" looks like at that machine. Weever handles all three.
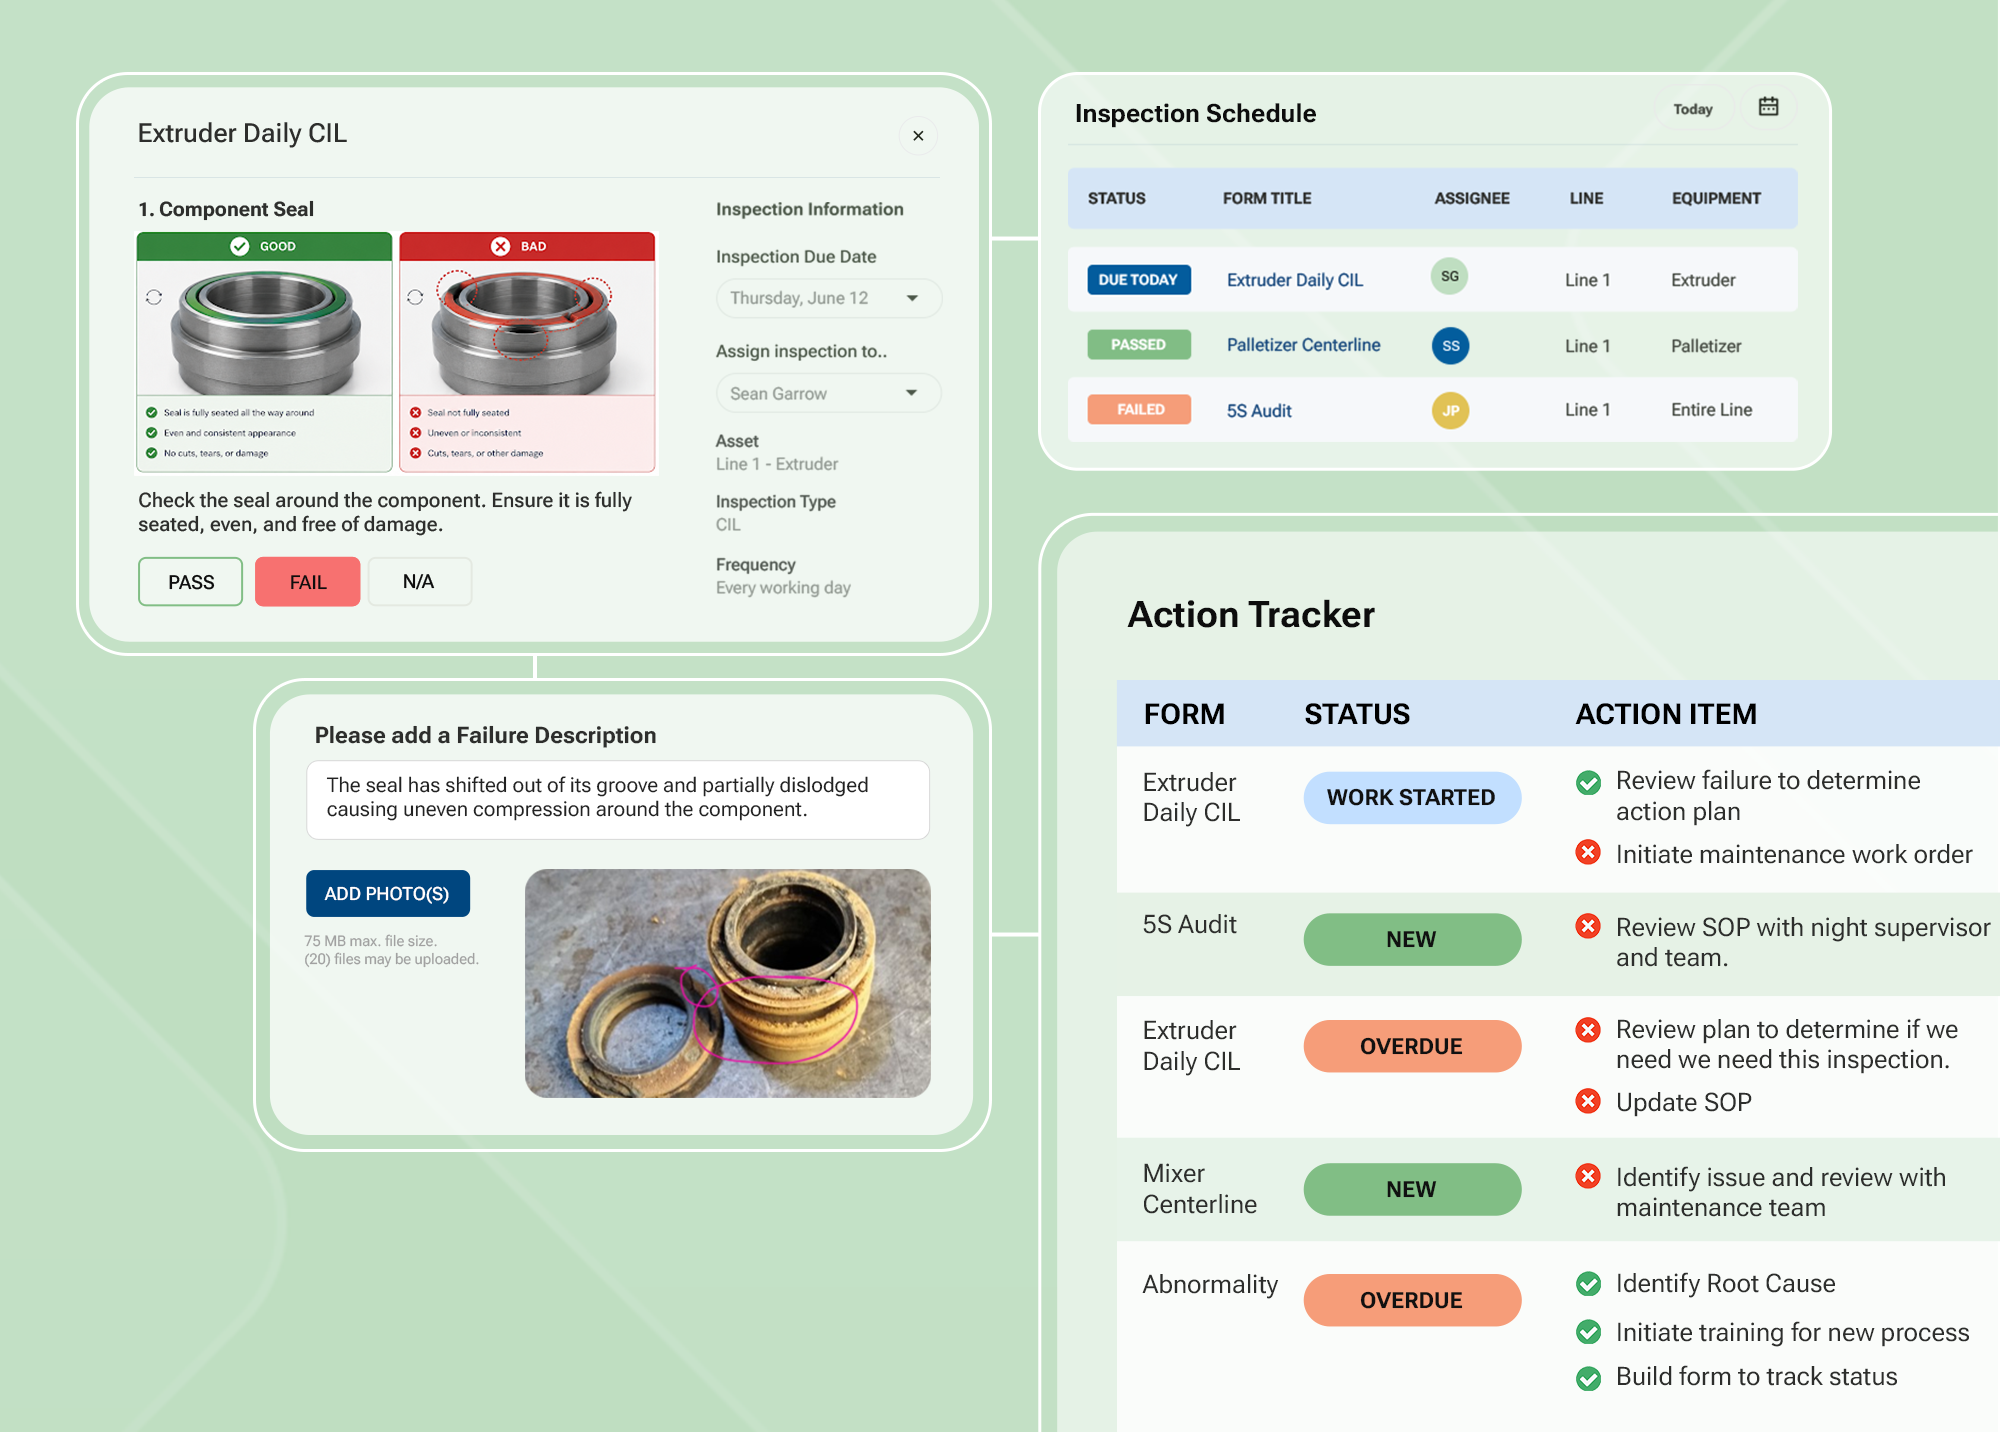
Form Builder: Do AM your way, not ours
Every plant's CILs, Centerlines, and 5S audits look a little different, because every line, every product, and every piece of equipment is different. Weever's Form Builder lets you build forms to match your program instead of requiring you to adapt your program to fit generic software fields.
Build your CIL checklists, Centerline ranges, 5S audit criteria, and Abnormality Reporting forms exactly the way your team already thinks about them, then push updates across every site without waiting on a developer.
Schedules: Make Sure High-Risk Areas Get Checked, Every Time
In manufacturing facilities we all know that it is not scheduled, it's not happening. Weever schedules and assigns inspections and audits automatically, so high-risk equipment gets checked at the frequency it actually needs, not whenever someone remembers.
Work Instructions: On-Demand, Real-Time Guides to Ensure The Work Is Completed Correctly
Knowing a check needs to happen is one thing. Knowing exactly how to do it correctly, on that specific machine, is another. Weever puts SOPs, One Point Lessons, video demonstrations, and reference images directly at the point of work, on demand, right where the operator needs them.
No walking back to the shop for the binder. No relying on whichever technician trained them three years ago. The instruction is right there on the device, at the exact step where it matters, so the job gets done correctly the first time.
2. Act
Turning Every Issue Into Closed Work, Not Lost Paperwork
Capturing an abnormality is only useful if something happens next. This is where most paper-based AM programs quietly die: the report gets filed, and then it disappears. Weever closes that gap.
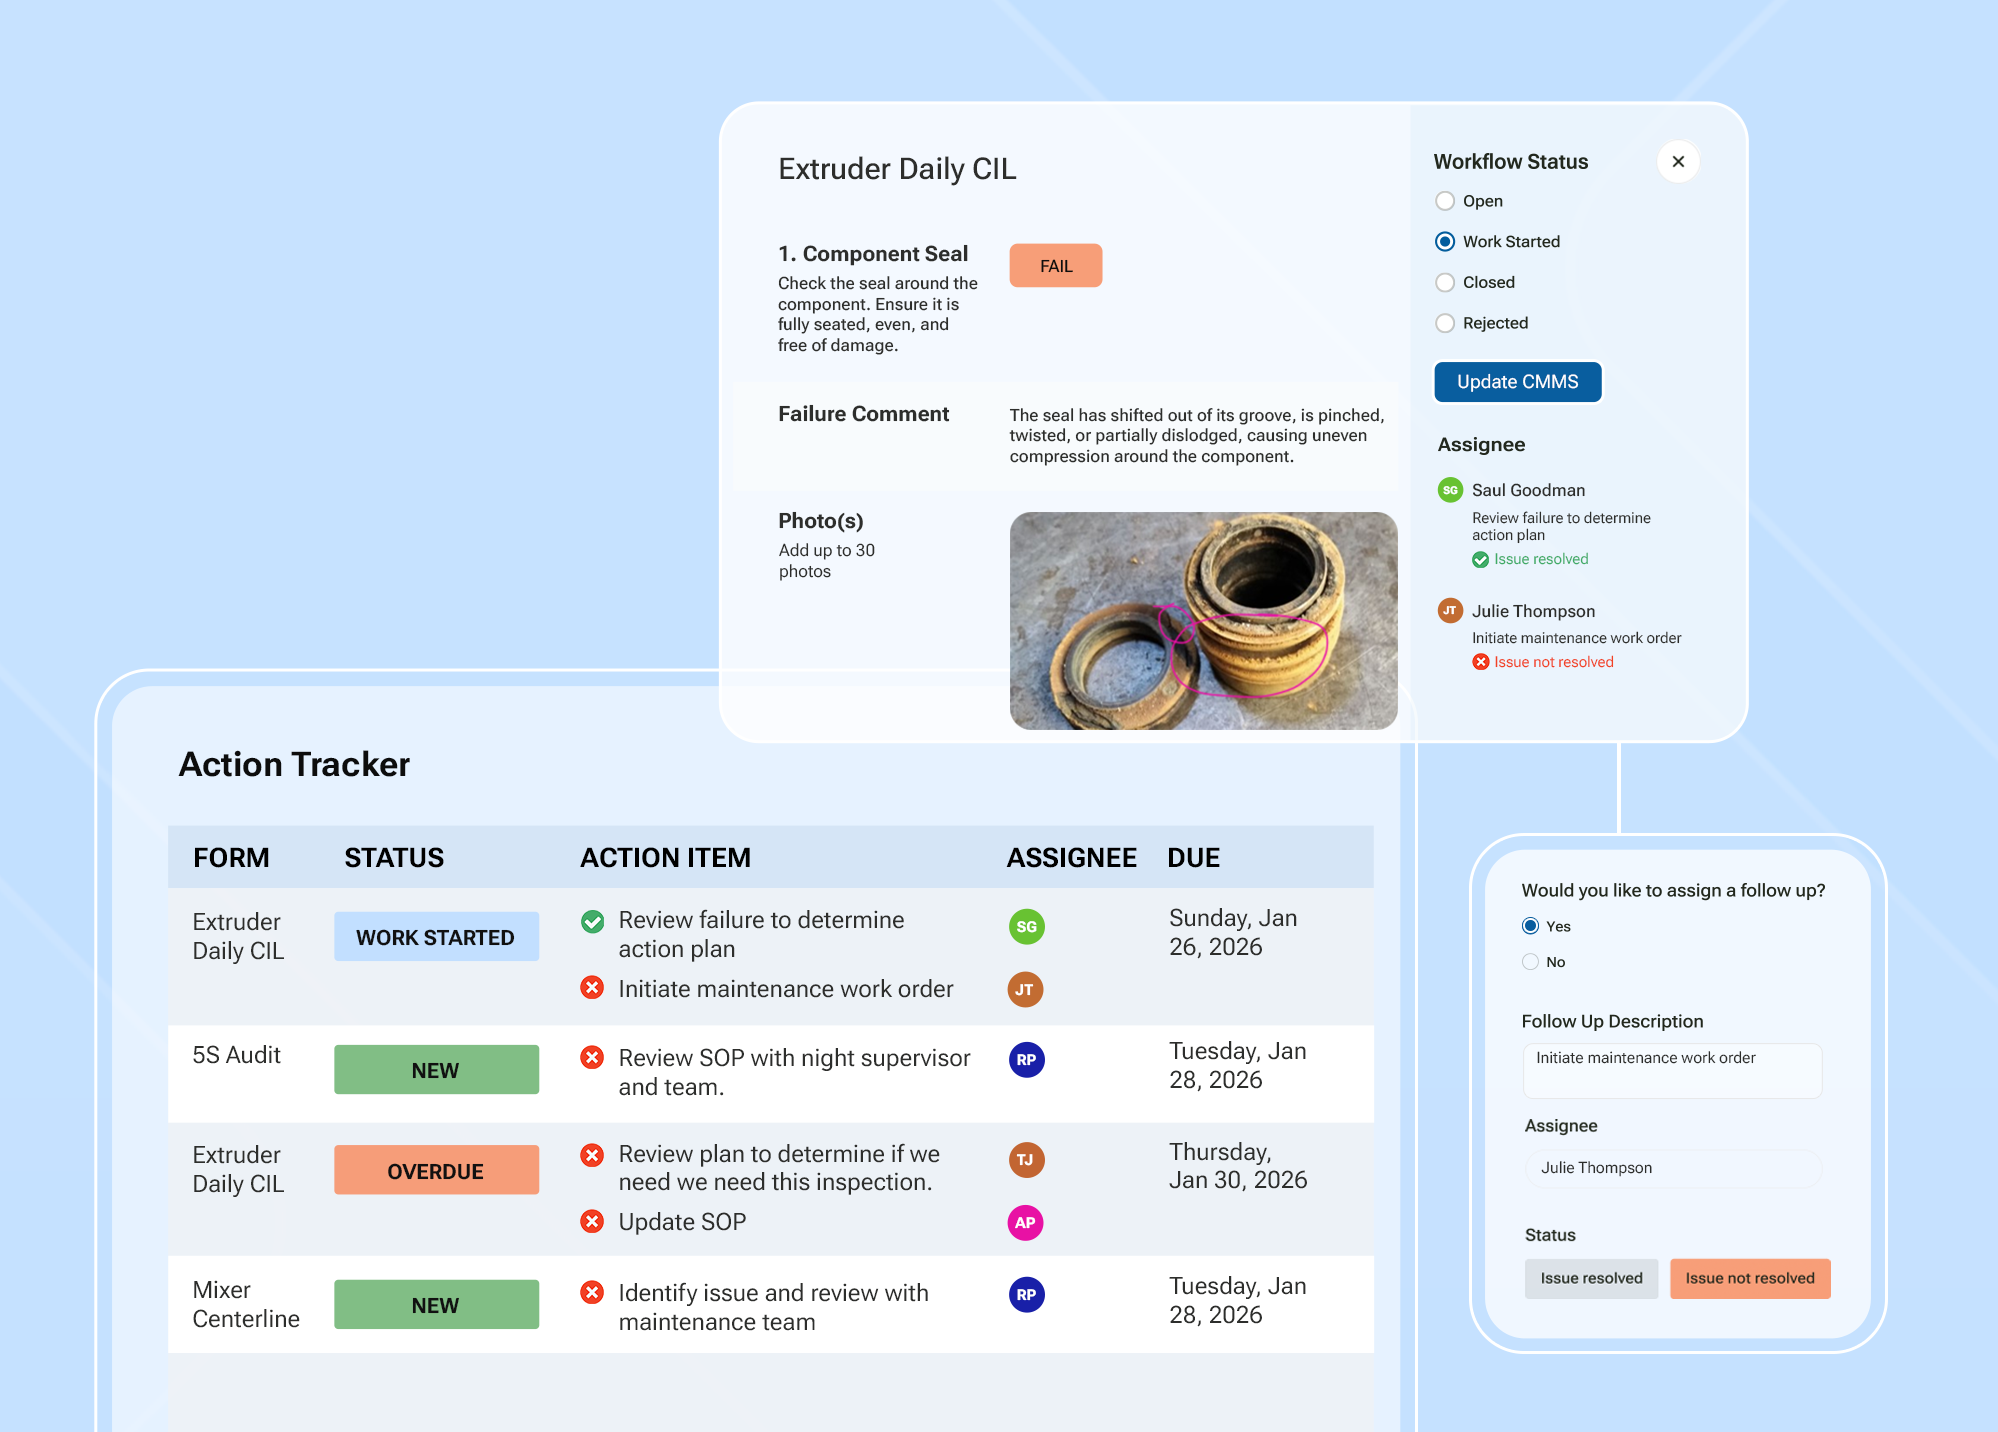
Action Tracker: Automatic Workflows That Route to the Right Person
The moment a check fails or an abnormality gets reported, Weever's Action Tracker automatically builds a workflow around it. Supervisors get exactly the information they need to understand the issue: what happened, where, when, and what condition triggered it, without having to track anyone down or dig through paper.
Action Items: Assign It, Track It, Prove It's Done
A workflow can carry multiple Action Items, each with its own assignee, due date, and description of the work required. When the assigned team member resolves it, they mark it complete, log the date, and note what they actually did to fix it.
That closes the loop that paper never could. Every issue has an owner. Every fix has a record. And because your team can see their reports actually lead to action, they keep reporting instead of quietly giving up on the process. The cost of an AM program that runs on paper isn't the paper. It's the abnormality that got reported, filed, and never fixed, until it became the breakdown you didn't see coming.
3. Analyze
Seeing What's Happening Now, and What's Coming Next
Once your data is trustworthy and your issues are actually getting resolved, you've got something most AM programs never reach: a real, structured record of what's happening across your plant. This is where Weever turns records into insights and decisions.
Weever Dashboard: Real-Time Visibility Into Completion
The Weever Dashboard shows the current status of every inspection and audit in real time, across every line, shift, and site. You're not waiting for an end-of-week rollup to find out a CIL got missed on nights. You see it as it happens, so you can course-correct before it becomes a pattern.
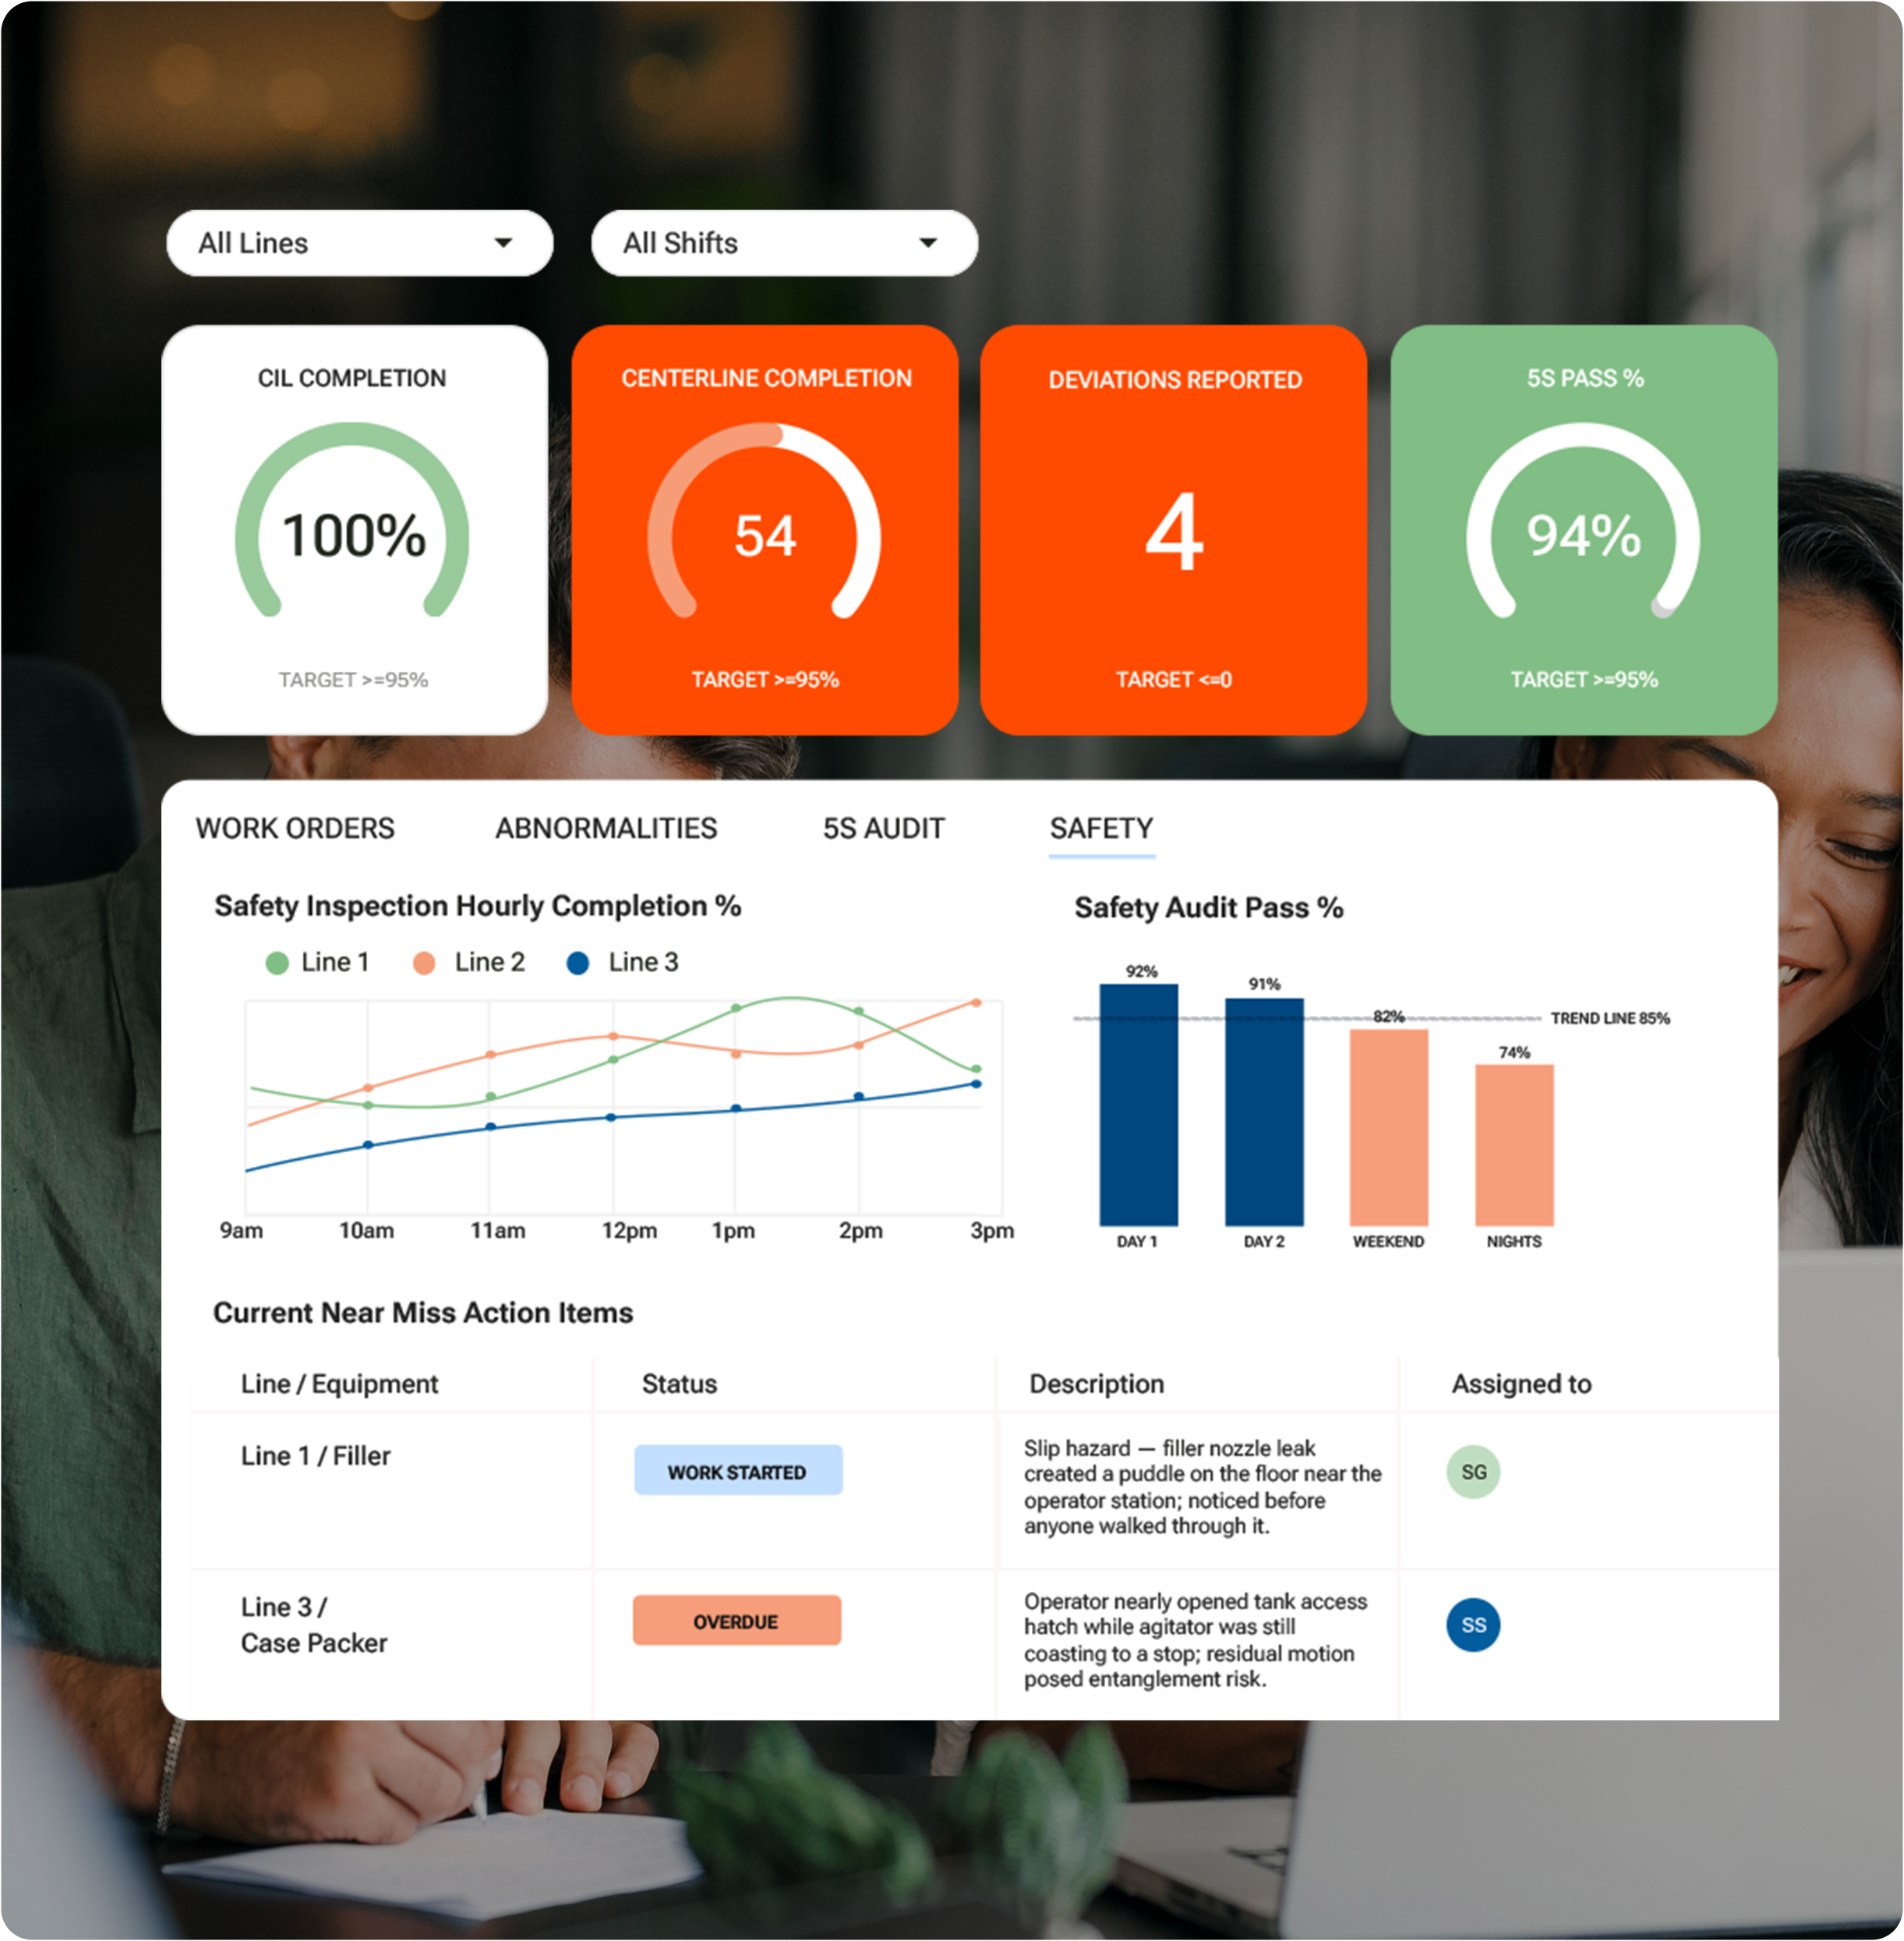
Data Feed: Feed Your BI Stack And Share With Other Systems
Your AM data shouldn't live in a silo. Weever's BI data feed makes it easy to share your frontline data securely with the business intelligence tools you already run, so your team can build the KPI dashboards and trend visuals that matter to your plant, without duplicate data entry or manual exports. You can also use the feed to share maintenance data with your CMMS so both systems are automatically updating each other.
Weever Radar: Ask Questions, Get Answers
Your operators already hear the bearing that's about to go. Weever Radar takes every abnormality, failed CIL, and out-of-tolerance Centerline reading your team has ever captured and turns it into a conversation. Ask what's driving downtime on Line 3, or which equipment is trending toward failure, and Weever Radar answers in plain language, tells you what it means, and recommends what to do next.
It's the difference between a dashboard that shows you numbers and a system that tells you what's actually happening and what to do about it, before a small deviation becomes a line-down event.
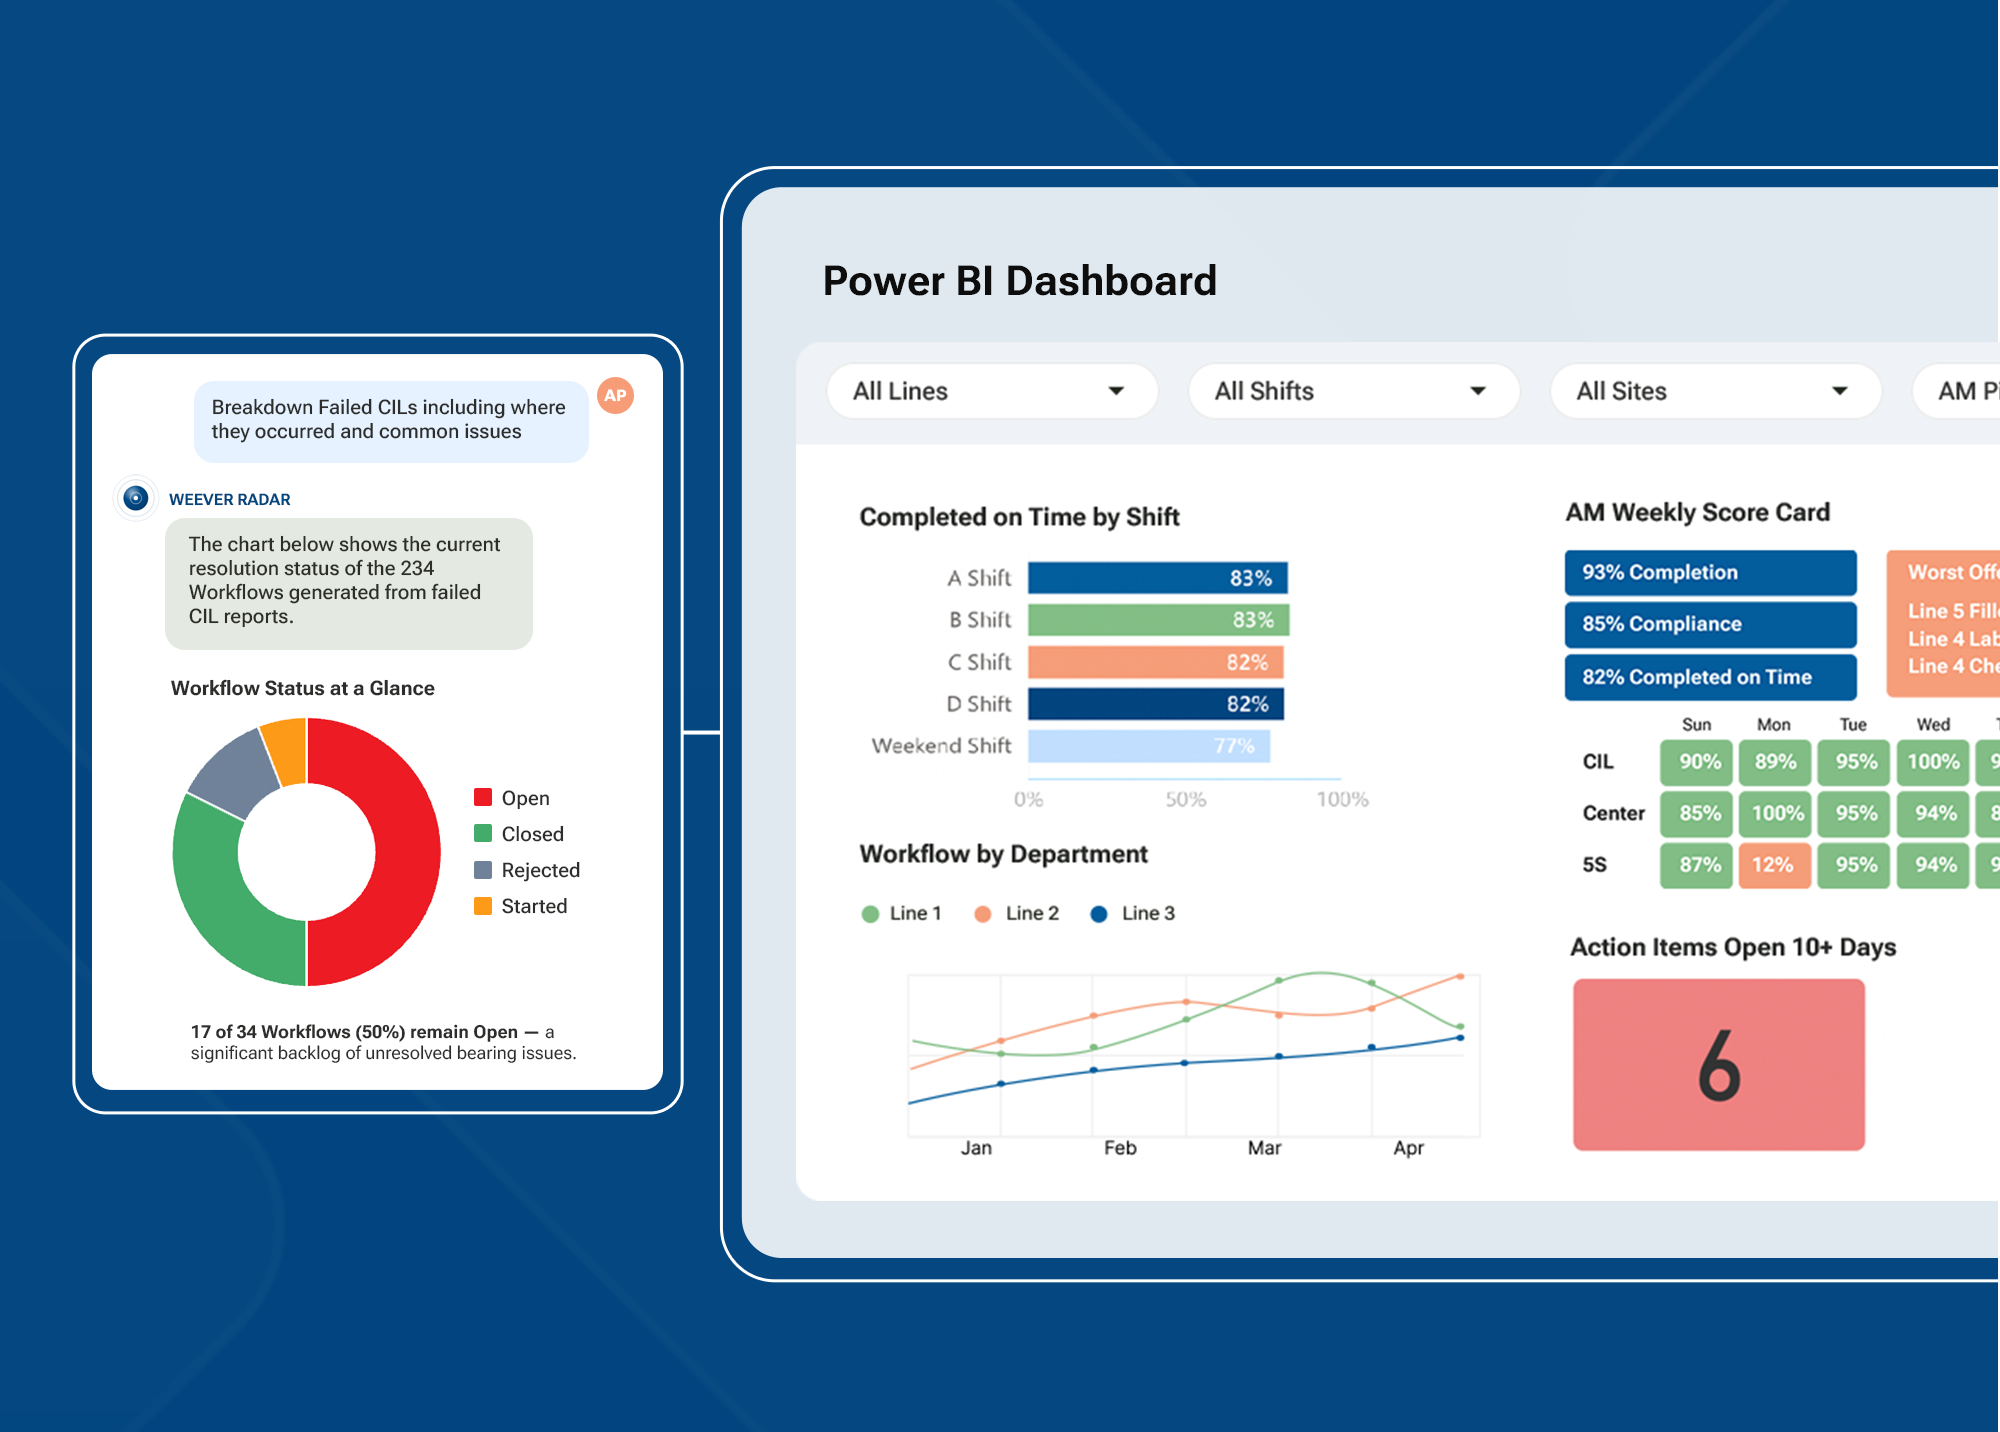
What a Connected AM Loop Is Worth
Once you run AM through Capture, Act, Analyze instead of paper, the numbers move fast:
- 30-50% reduction in breakdown frequency within the first year of a sustained AM program (Innovapptive, 2026).
- 15-25% OEE improvement within the first two years.
- A 10-point OEE gain on a packaging line can translate to roughly 15% more capacity, with no capital investment.
- Reactive maintenance costs 3-5x more per event than planned work.
- One widely cited AM case study, the Assela Malt Factory, saw a 46% drop in monthly breakdowns, a 64% reduction in maintenance costs, and 23% of technician time freed up for preventive work over an 18-month program.
- Weever customers report 500%+ increases in AM participation once teams move off paper, simply because the tool is easier than the binder it replaced.
Most food and beverage plants run at 55-65% OEE, well below the 85% world-class benchmark. The gap between those numbers is rarely a technology problem. It's a data problem: checks that don't get done, issues that don't get closed, and patterns nobody can see until it's too late.
Why Manufacturers Choose Weever for AM
- Built for the floor, not the boardroom. Weever was built by people who've worked in plants and know exactly what doesn't get used. Shared devices, multiple languages, no app install, no login. Adoption happens on the first shift and it sticks.
- Live in weeks, not months. There's no year-long implementation, no developer team required. Build your forms, schedule your checks, and start capturing real data fast.
- Priced for the whole plant. Weever is priced per site, not per user, so every operator who needs it can use it, without a per-seat cost gatekeeping adoption.
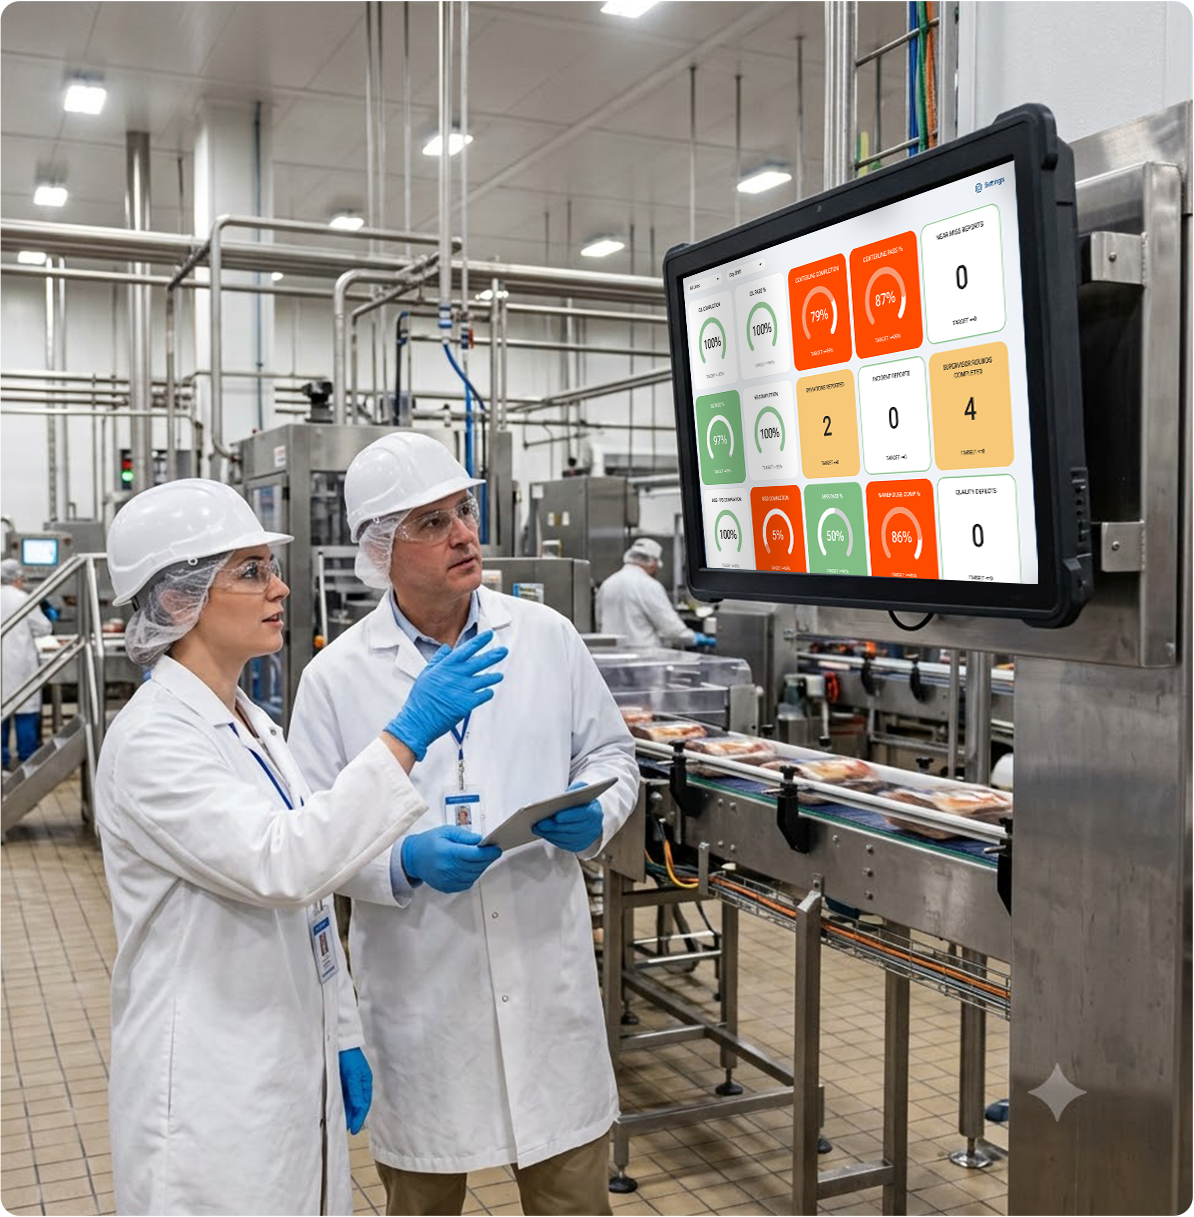
An AM program is only as strong as the data behind it, and the data is only as strong as the loop that captures it, acts on it, and turns it into insight. That's the whole point of running Capture, Act, Analyze as one connected system instead of three disconnected steps.
Want to see how Weever's Capture, Act, Analyze loop would run on your own lines? Book a demo and we'll walk through your CILs, Centerlines, and abnormality reporting live.
How to Digitize Paper Forms in Manufacturing to Reduce Admin Work and Labor Costs
If you're looking at how to digitize paper forms in your manufacturing plant, we bet you're probably tired of wasting time and budget on the same issues — audit findings that keep coming back, corrective actions that never close, and quality or safety issues that surface too late to prevent them.
But what most facilities don't realize is that the approach you take to digitization determines whether you can actually solve these problems.
Done right, you get real-time visibility into what's happening on the floor, automatic follow-up on every issue, and a significant reduction in the documentation gaps and missed corrective actions that manual processes create.
Done wrong, you invest months in a rollout that doesn't fit how your plant actually operates, which creates more workarounds than the paper process you were trying to replace.
That's why we want to make sure you get it right the first time. This guide walks you through digitizing your paper forms without disrupting your operations, so you come out the other side with less admin work, lower labor costs, and programs that actually move the needle on safety, quality, and continuous improvement.
Which paper forms should your manufacturing plant digitize?
There are likely many forms in your organization that you could digitize. But for this article, we’re focused on the ones your frontline uses every shift to document all the work you’re doing: Master Sanitation Schedule logs, 5S audit sheets, AM/CIL inspection forms, BBSO observation cards, quality inspection and deviation records, shift handoff records, corrective action logs, and more.
When digitized correctly, these forms will have the greatest impact in reducing admin work and labor costs across your facility. But success depends on choosing an approach that does three things:
- Reliably captures information at the point of work
- Enables you to take action, automatically delivering the right information to the right people, in a way that replicates how your team operates
- Produces a complete picture of what’s happening across your programs in real time, so you can spot issues sooner and improve faster
Getting all three right is what separates a digitization project that actually solves the paper problem from one that doesn't.
How to digitize paper forms without disrupting manufacturing operations
The most common mistake we see when manufacturing plants try to switch from paper to digital is choosing a tool that doesn’t work for the floor.
In our experience, most digitization tools that claim to work for manufacturing don't actually work for the people on the floor. That's because they use generic templates and locked workflows that can't accommodate the unique structure of your programs. When a tool doesn't fit the way you and your team operate, it forces everyone to either rebuild processes around the software or find workarounds just to get things done.
That's where the real problems start. When digital forms lack the necessary fields, for example, operators can't document the required information. So they'll either skip the step, record the information somewhere else, or go back to the paper forms they used before. In no time, there are two systems running side by side, making the overall workload heavier, and the data arguably less accurate because it's now scattered across multiple digital and paper formats.
We don't think this makes any sense. That's why the steps below demonstrate a better approach: digitizing the processes your teams already follow rather than redesigning them to fit rigid templates and workflows. When everyone is doing the same work they've always done, just without the paper, adoption happens naturally without disrupting operations, and the problems that prompted the switch actually start to disappear.
5 Steps
How to digitize paper forms without disrupting manufacturing operations
Identify the program you want to focus on
Map how your current paper-based program runs
Digitize your paper forms
Remove the friction around accessing and completing digital forms
Build automatic follow-up into your workflow
Step 1: Identify the program you want to focus on
While the temptation might be to digitize all of your forms at once, we advise against this. Too much change in a short period of time will only increase the potential for failure. Instead, start with one program that lets you prove the model, build internal confidence, and create a replicable approach for the next one. To do this, we recommend beginning with a program that generates significant admin and labor costs. Here’s how to assess this:
- Admin Burden Programs that require the most manual effort after paper forms are submitted — collecting sheets, re-entering data into spreadsheets, tracking down missing information, and following up on action items that should have an owner.
- Labor Cost Programs where that admin burden falls on your most expensive people. A CI Manager spending two hours a day reconciling AM inspection data, or a sanitation supervisor chasing corrective actions by email. This is a significant and recurring cost that a digital workflow could eliminate.
Step 2: Map how your current paper-based program runs
Once you’ve identified a starting program, map exactly how it runs on paper. The goal is to understand it well enough to replicate it digitally, not to change it. Trying to redesign and digitize simultaneously will only complicate the process and stall the rollout before it delivers any value.
The mapping should cover the full workflow, not just the forms. Here’s what that might look like for each program:
- MSS: Understand which tasks get assigned to which crews, at which frequencies, across which zones, and what happens when a task fails or is missed. Who gets notified? Who assigns the follow-up?
- 5S: Identify how audits are scheduled, how scores are calculated, and how findings are currently assigned, reviewed, and tracked to closure.
- AM: Know the inspection sequence tied to specific equipment, who reviews completion, and who in maintenance is notified when a check fails, or a defect is found.
- BBSO: Learn how observations are currently submitted, how at-risk findings get routed to the right supervisor, and how corrective actions are currently assigned and tracked.
The answers to those questions will allow you to replicate the workflows in your digital system. When you can build the right notifications, assignments, and follow-up steps into an automated tool, you’ll be able to eliminate the manual coordination that paper-based processes require.
Step 3: Digitize your paper forms
With your program mapped, build your digital forms to match it exactly, using the same field names, task descriptions, and terminology your teams already recognize. Also, make sure to include the elements that make digital forms more reliable than their paper equivalent:
- Required fields so operators can’t skip steps
- Dropdowns instead of free-text entries that become illegible or inconsistent
- Photo and video capture so operators can attach evidence at the point of work
- Automatic timestamps and user IDs, so you don’t need to rely on someone to write them in
These elements will ensure your digital forms capture clean, structured data from the start, rather than inheriting the same challenges as paper forms.
Step 4: Remove the friction around accessing and completing digital forms
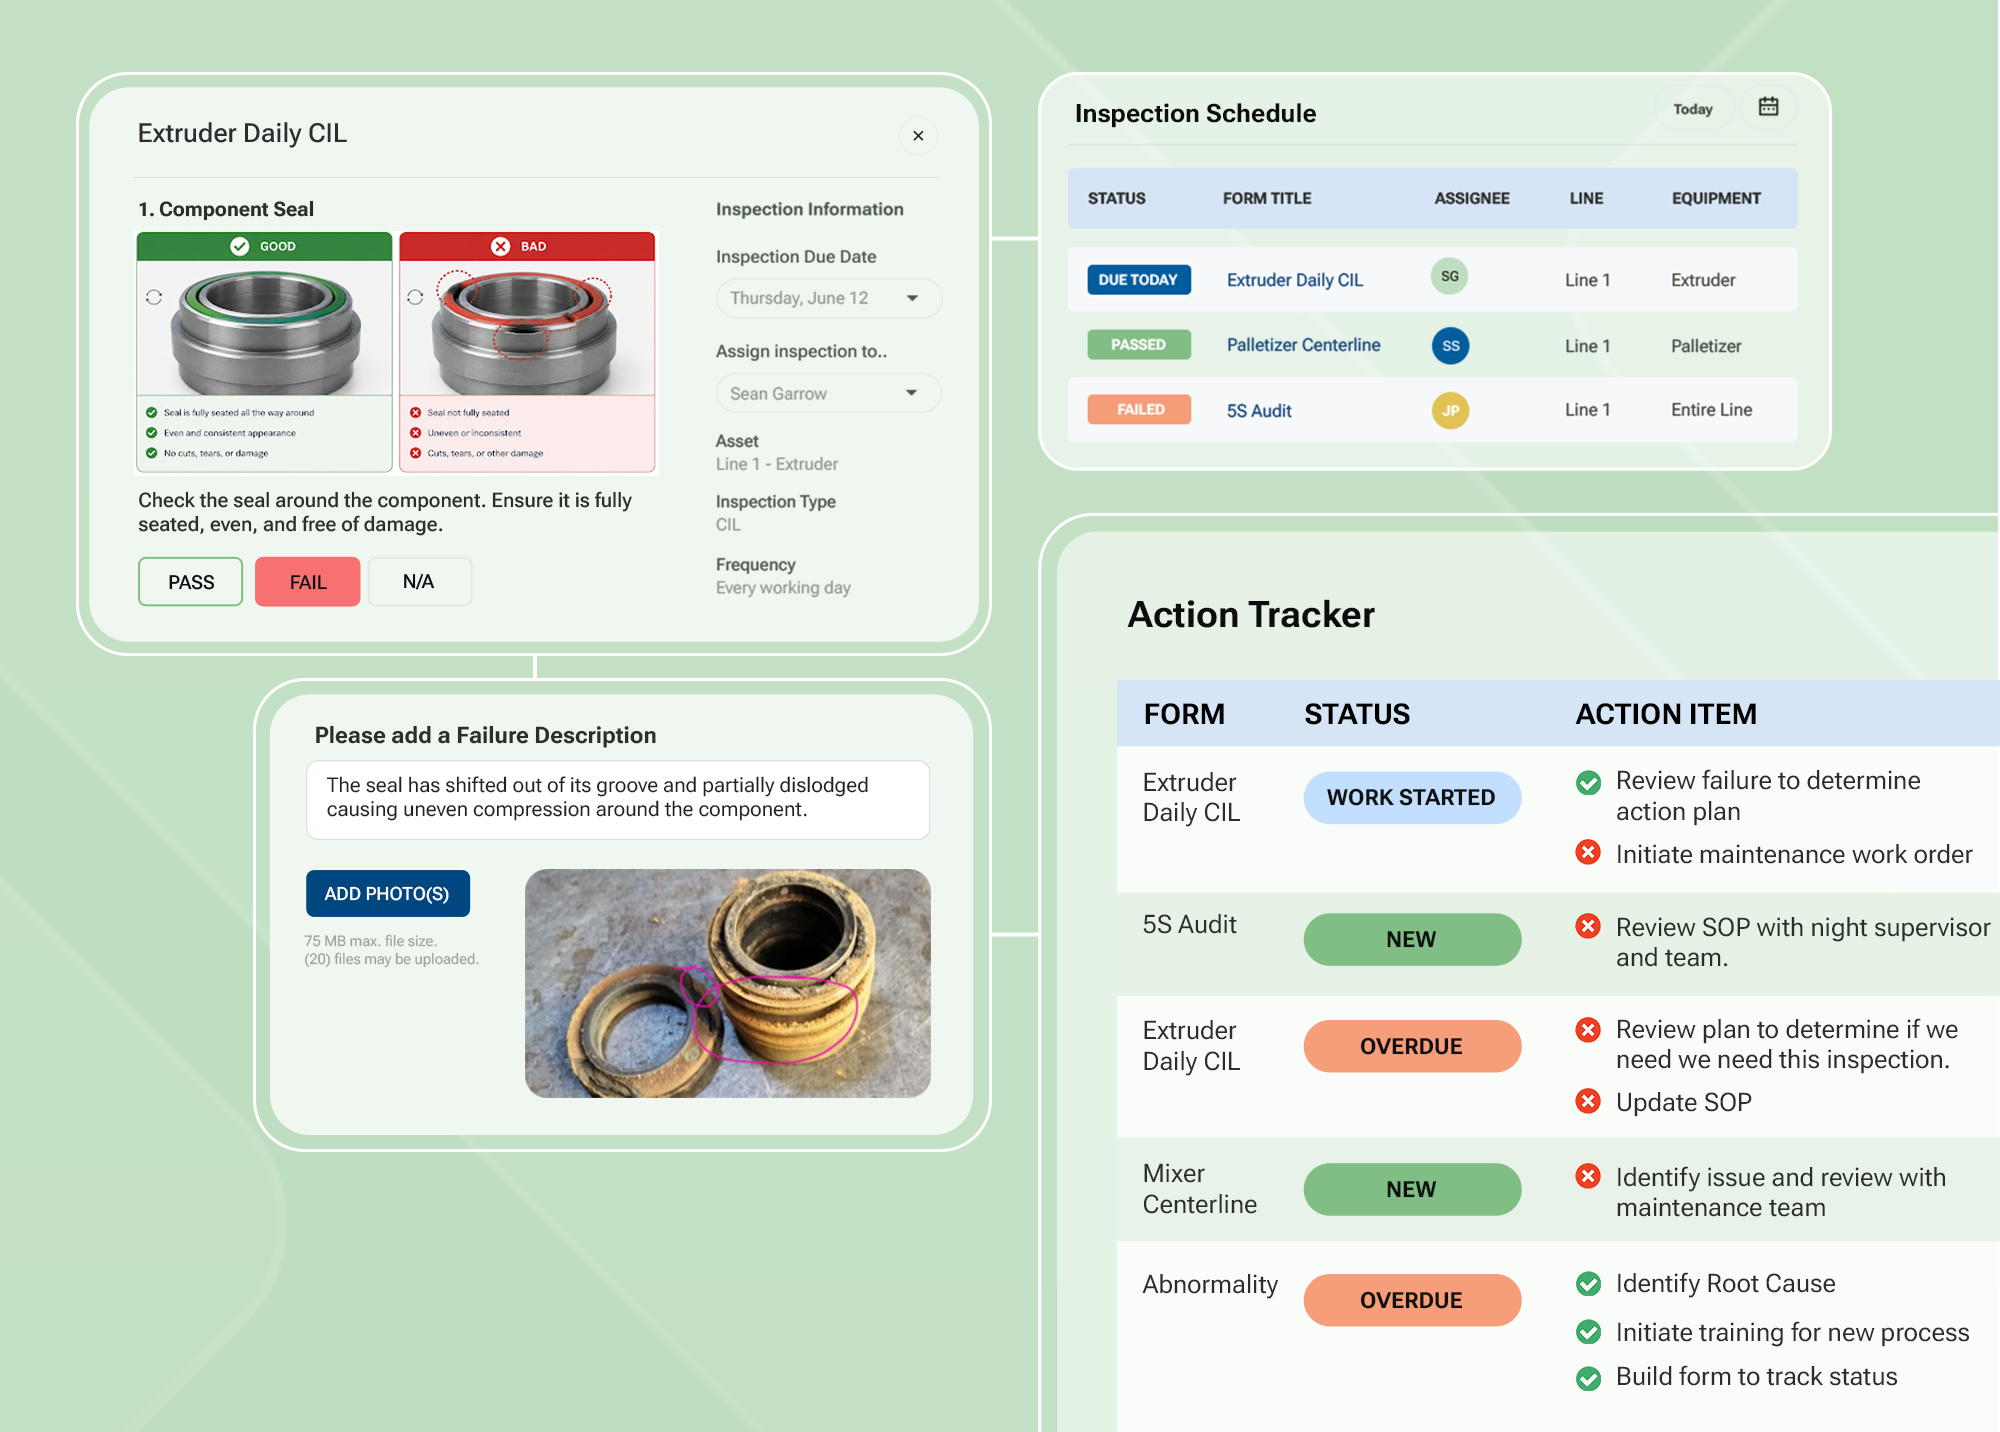
If operators have to remember a login or track down a device before they can complete a form, that friction will cause them to find workarounds. Digital forms also need to be accessible at the point of work and easy for anyone to fill out. From there, make sure to take advantage of digital form capabilities that simplify input, including:
- Adding conditional logic to make data entry more intuitive by showing operators only the fields relevant to what they’re doing at that moment.
- Embedding visual instructions directly in the form to reduce the need for supervisor explanation and support operators who are new to a task.
- Use multilingual support and voice-to-text input to ensure language barriers don’t prevent participation, particularly for third-party crews or non-English-speaking workers.
The easier the form is to access and complete, the more consistently teams will use it, and the more reliable the data it will produce.
Step 5: Build automatic follow-up into your workflow
Once you’ve set up your digital forms, configure your workflow to:
- Automatically create corrective actions with a named owner and a due date
- Notify the right supervisor without anyone having to send an email
- Track issues to completion
- Escalate any overdue items
Your routing logic from Step 2 is already documented. You just need to build it into the system so it happens automatically.
Once your digital forms are running properly and you can see the impact in reduced admin time, corrective action closure rates, and completion data you can trust, use the same process to expand to the next program. This approach will ensure you can digitize your forms systematically to maximize adoption and success.
What digitizing your paper forms saves in admin time and labor costs
Most manufacturing leaders we've talked to have never added up what paper actually costs them. But without this information, it's easy to underestimate how much digitizing your forms will save, and hard to build a case for change.
The biggest challenge to calculating these costs is that they don't appear as a single line item. In our experience working with mid-size manufacturing plants, paper supplies alone run around $60,000 a year — roughly 200,000 sheets once printing, controlled storage, and proper disposal are included. But the higher costs are the ones buried in salaries and working hours that paper-based systems create at every stage of your process. Here's where those costs actually live.
The hidden cost of paper
What digitizing your forms saves in admin time and labor costs
Admin overhead
14 hrs
per week, per sanitation manager — on scheduling, managing, and reporting forms
Re-entry errors
40%
of calibration records contain errors in paper-based two-step processes
Follow-up coordination
933 hrs
per year lost to manual follow-up — 23 full working weeks at $32K–$56K in labor
Audit prep
40 hrs
lost per audit cycle pulling binders, reconciling spreadsheets, and chasing corrective actions
One manufacturer absorbed $200,000/year in product holds tied to paper documentation gaps. After digitizing with Weever, that number dropped to zero. Sources: Weever Sanitation Gap Report, 2026; Quality Magazine; ScienceDirect.
Admin overhead before and after every shift
The paper form admin burden starts before operators even pick up a pencil. Someone has to print and distribute forms ahead of every shift, ensure packets are complete, and make sure the right forms are at the right location. After they're submitted, someone has to collect them, check them for completeness, and store them in a way that makes them retrievable for audits.
In sanitation alone, managers spend an average of 9.2 hours per week on scheduling and managing forms and another 4.75 hours on reporting, totaling nearly 14 hours per week [Weever Sanitation Gap Report, 2026]. These are low-value tasks that a digital system could handle automatically.
Version control adds another layer of administrative burden (and risk) that most plants don't factor in. When a field changes or a spec is updated, operators using outdated forms continue to capture data against the wrong standard. By the time someone notices, the records are already non-compliant, which is exactly the kind of documentation gap that surfaces as an audit finding.
Data re-entry errors and the skilled labor they consume
Every paper form that gets submitted creates a second job: someone has to check it for legibility, re-enter the data into a spreadsheet or system, and reconcile any gaps or errors they find along the way. That work falls to your most skilled people — CI Managers, quality leads, and sanitation supervisors — and it happens every shift.
Re-entering data also introduces issues that create more work downstream. In a two-step paper-based calibration process, where operators write data down in the field, and someone else re-enters it manually into a system, 40% of calibration records can contain errors [https://www.qualitymag.com/articles/96853-manual-data-entry-and-its-effects-on-quality]. Finding and fixing those errors takes time that your skilled people should be spending on the floor. And when issues are missed, this creates compliance exposure that often surfaces during audits or investigations.
The financial consequences can be significant. One manufacturer we worked with absorbed $200,000 a year in product holds tied to exactly these kinds of documentation gaps before moving off paper. After digitizing, that number dropped to zero. In food manufacturing specifically, those gaps can escalate further. When plants can't quickly identify outbreak sources, they face overly broad recalls that can impose median costs of $3.0M to $72.7M per producer [https://www.sciencedirect.com/science/article/pii/S0362028X2500002X].
Weeks spent on manual follow-up coordination
Paper forms have no way to tell anyone that something needs to happen next. When an operator flags a failed check or a safety hazard, follow-up actions depend entirely on whether the right person reads the form and remembers to take action.
In a plant running MSS, BBSO, 5S, and AM, operators complete hundreds (or even thousands) of forms every month. In fact, a single 5S program can generate more than 60 open issues per month that need to be assigned, tracked, and closed. Multiply that across every program, and the hours add up quickly.
Sanitation managers alone lose an average of 933 hours per year to this kind of coordination work [Weever Sanitation Gap Report, 2026]. That's roughly 23 full working weeks spent on admin instead of the job they were hired to do. At a fully-loaded labor rate of $35 to $60 per hour, that's $32,000 to $56,000 per year spent on administrative tasks. CI Managers, safety coordinators, and quality leads carry the same burden across their programs.
Hours lost to report-building and audit prep
Between pulling binders, reconciling spreadsheets, and chasing corrective actions that may or may not have been closed, audit prep typically consumes two to five days per cycle. That means teams can lose up to 40 hours per audit cycle to prep alone, which could be spent on driving improvement, instead of assembling paperwork. And that doesn't account for the additional hours spent fixing audit findings that should have been resolved months earlier.
For most plants, this cycle repeats multiple times a year across multiple programs, consuming hundreds of hours of skilled labor and incurring associated costs that never appear as a single line item.
5 key benefits
5 key benefits
What actually changes once your digital forms are up and running
Admin work shifts from managing records to managing exceptions
Managers move from chasing paperwork to floor oversight and improvement work.
3–4 hrs saved per day on data management — MoninReal-time visibility lets you act before it's too late
See which tasks are complete, overdue, or failed — the moment they're recorded.
46% improvement in sanitation compliance — Mars Snacking, WacoCorrective actions close instead of disappearing
The system assigns and tracks every action through to closure automatically.
60 → 5 open issues per month, audit scores 85%→97% — AdientReport-building and audit prep become a fraction of the work
Reports build themselves. The audit trail is live the moment work is recorded.
7,000+ hrs saved annually, 95% corrective action closure — Royal CaninPrograms scale without proportional admin growth
Roll the same program across every line, shift, and site — admin overhead stays flat.
Once you digitize your paper forms, the changes show up across every part of how your programs run, from how operators complete their checks to how you report to leadership. Here are five main benefits:
1) Admin work shifts from managing records to managing exceptions
As we’ve established, in a paper-based program, you and your team spend a significant portion of your day on the admin that paper creates — chasing incomplete or illegible records, re-entering data into spreadsheets, following up on corrective actions that weren’t assigned, and manually assembling reports from data scattered across binders and spreadsheets.
Once forms are digital, you eliminate most of that work. For managers, time shifts to more value-driven tasks, including floor oversight, coaching, and improvement work. For operators, it removes the guesswork. The guidance is there when they need it, so they can complete their checks correctly without relying on memory or hunting down a supervisor.
Monin, a flavored syrup manufacturer we worked with, saved 3 to 4 hours per day on manual data management and reporting after digitizing across their programs.
2) Data provides real-time visibility that allows you to act before it’s too late
On paper, you often don’t find out an issue occurred until after the fact, when the window to act may have already closed. But with digital forms, you can see in real time which tasks your team has completed, which haven't been started, which are overdue, where something failed, and which corrective actions are still open. This visibility allows you to work more proactively.
Mars Snacking's Waco facility saw a 46% improvement in sanitation task completion and compliance rates after we helped them digitize their processes, with missed checks dropping from 7 to 2 per period.
3) Corrective actions close instead of disappearing
On paper, a failed sanitation check, a flagged safety hazard, or an open 5S finding all have the same problem: follow-up depends entirely on someone remembering to act. With digital forms, the system automatically creates a corrective action, assigns it to the right owner, and tracks it through to closure.
Adient, an automotive parts manufacturer we worked with, reduced open issues from more than 60 per month to fewer than 5 after digitizing its 5S program, with audit scores climbing from 85% to 97% across the plant. Similarly, Baywater, our pipeline services client, achieved a 92% corrective action completion rate, a metric they had never had visibility into before.
4) Report-building and audit prep become a fraction of the work
Instead of manually compiling data from binders and spreadsheets, your reports build themselves as work happens. Live dashboards show completion rates, open issues, and deviations by area, line, shift, and site the moment teams record information, giving everyone from floor supervisors to plant leadership the same up-to-date picture.
When you need to go deeper, paperless form submissions generate structured reports that are automatically filterable and exportable by date, location, or program. Audit prep that used to take days now takes hours because the audit trail builds itself in real time.
Our pet food manufacturing client, Royal Canin, saved more than 7,000 hours annually after digitizing, achieving a 95% corrective action closure rate across more than 6,000 monthly submissions.
5) Programs scale without proportional admin growth
With paper, every new line, shift, or site adds more forms to print, more binders to manage, and more variation in how the same program runs across the business. At some point, keeping the paper process running becomes someone’s entire job.
Digital workflows allow you to roll out the same program across every line, shift, and site without rebuilding it from scratch each time, and the admin overhead stays flat as the operation grows. Besides this, leadership gains something paper can’t provide: a consistent view of how programs are running across all locations at all times.
After working with us, Mars Fort Smith achieved 100% completion of sanitation tasks across all tasks managed through our digital platform. Our client, Martin SC, also saved more than $70,000 annually after digitizing.
What to look for in a digital forms software solution
To ensure the digital forms software you choose will work for everyone in your plant — from executives to operators — we recommend evaluating how well it achieves three main capabilities:
- Capturing the right data
- Allowing you to act on issues as they happen
- Enabling you to analyze what’s happening in real time
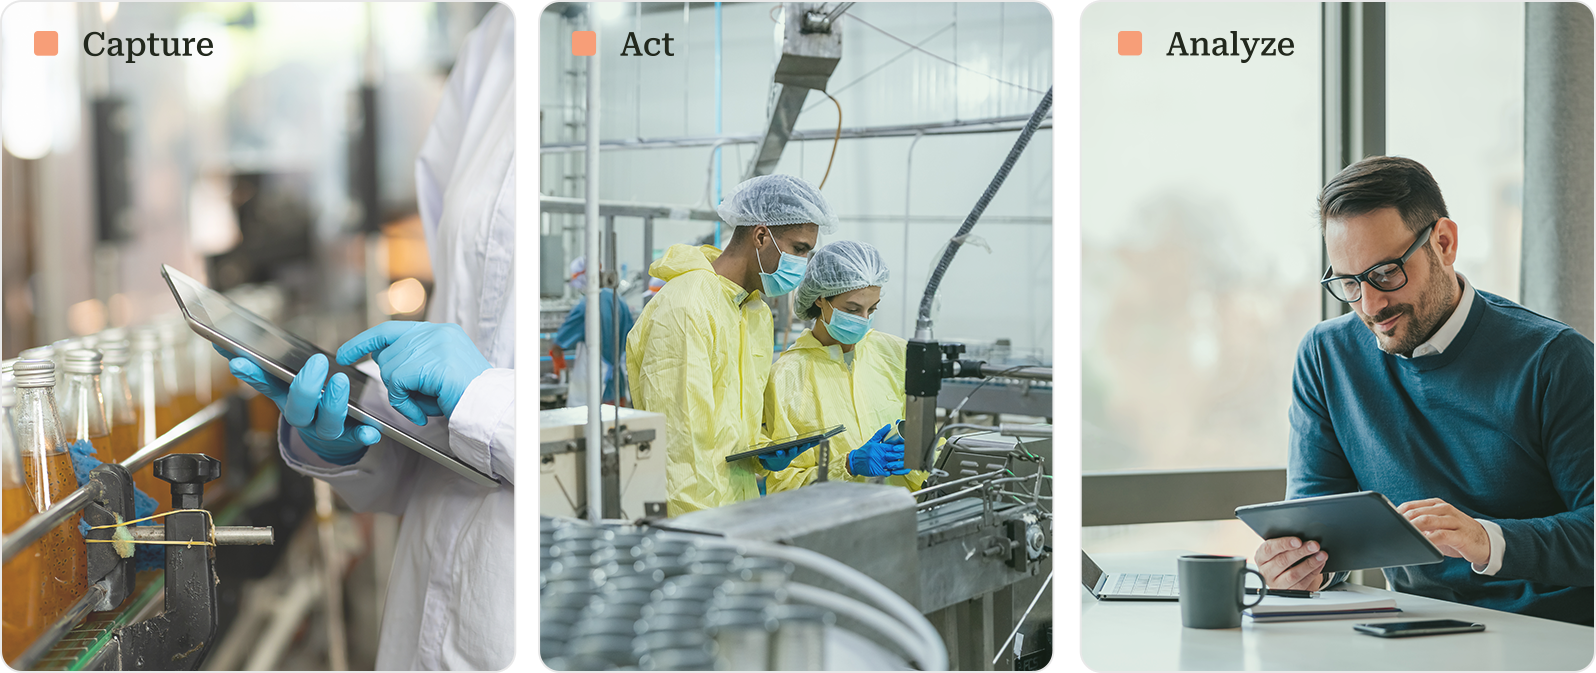
Capture the right data, right on the floor
Digital data capture must be as easy as possible for every operator on the floor, regardless of their role, native language, or device. This requires:
Shared device access and QR code form launch
Any operator should be able to scan a QR code at the machine or workstation and open the correct form instantly on a shared device, without a personal login or an app. If the tool requires individual accounts or assigned devices, the access friction it creates will only cause team members to find workarounds.
Required fields, validation rules, and conditional logic
The tool should allow you to set required fields so operators can’t move past a step without completing it, create validation rules that catch out-of-range entries before a form is submitted, and apply conditional logic that shows operators only the fields relevant to their specific situation. Without these capabilities, digital forms will capture data the same way paper does — inconsistently and with the same gaps.
Photo, video, and e-signature capture
Visual evidence capture is what makes a completed check verifiable. Photo and video capture at the point of work creates a record that can withstand audit scrutiny. E-signatures lock records at the point of verification and support FDA and GFSI compliance requirements.
Multilingual support and visual instructions
If operators can’t read the form in their language, participation will drop, and errors will increase. Your tool should enable multilingual support and embedded visual instructions to ensure every worker on the floor can complete forms correctly without supervisor intervention.
Act on every issue
When you and your team identify issues, the information needs to flow to the right people automatically, without depending on anyone to make it happen. Specifically, this means your digital forms tool needs to provide:
Corrective action tracking, notifications, and escalations
Your digital tool should automatically create a corrective action with a named owner and a due date. It should also send a notification to the right supervisor. Make sure this capability lives in the same tool your operators use to complete forms. If corrective actions have to be managed elsewhere, you're back to chasing information across systems. Also, ensure items that go overdue will escalate automatically, so nothing sits unresolved.
Analyze what’s happening in real time
Capturing data is only valuable if you can see it, retrieve it, and use it. To analyze data properly, the tool you choose needs to offer:
Searchable records and audit trails
You should be able to automatically generate a complete, timestamped record for every form completed on the floor, linked to the specific user, area, and task, and retrievable in seconds by date, shift, line, or location. If finding a specific record still requires navigating multiple folders, exporting data to a spreadsheet, or manually piecing together information from multiple sources, you won’t be able to identify potential risks, proactively address issues, or determine how to close existing gaps.
Reporting by line, shift, area, and site
Look for a tool that automatically generates reports from data captured by operators, without anyone having to build them manually. It should deliver different views for different roles: operators need to know what’s due and what’s behind on their shift, supervisors need to see completion status and open issues across their area in real time, CI Managers need plant-level performance summaries they can act on, and regional leaders need cross-site visibility to benchmark locations and identify where programs are working and where they need attention.
Integration options
Most manufacturing plants already have enterprise systems — SAP, a CMMS, OEE tools — but those systems weren’t designed to capture what happens at the operator level on the floor. The right digital forms tool fills that gap without creating a separate data silo. Look for a tool that connects via API and webhooks so data captured on the floor flows directly into the systems your teams already rely on for reporting, maintenance planning, and compliance.
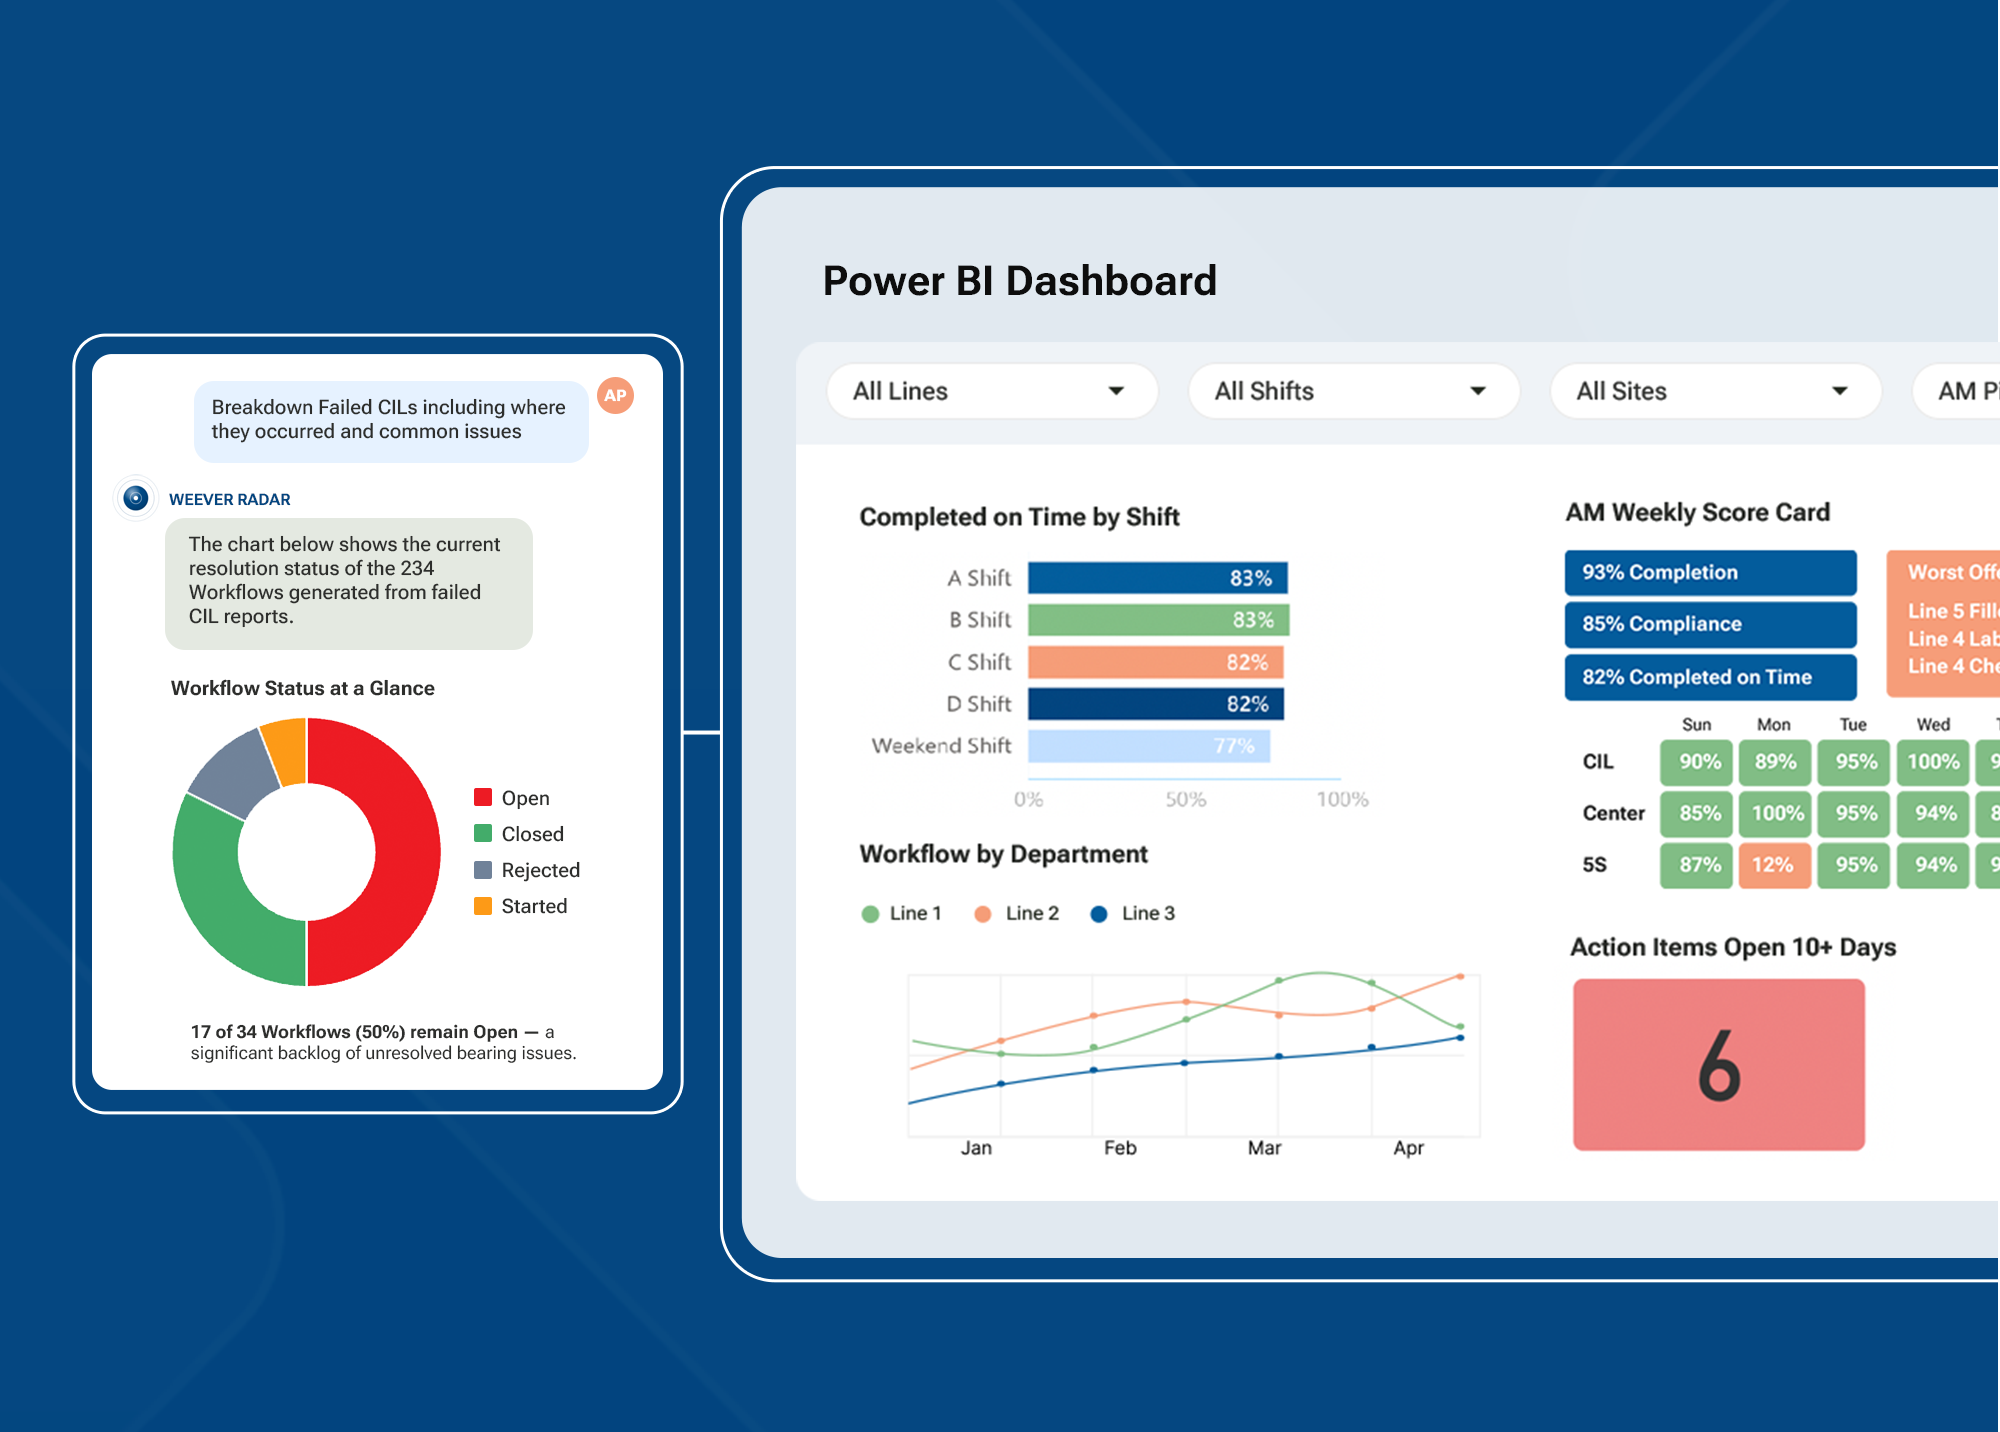
Why manufacturers choose Weever to help them go paperless
Digitizing your paper forms shouldn't mean months of configuration, process redesign, or change management. That’s why we built Weever, our connected worker platform that helps manufacturing leaders ditch the paper without disrupting how their teams work. Here's what makes our software different from every other tool that claims to meet the criteria above.

Built on the floor
Weever wasn't built in a software lab. Our founder spent more than 25 years in manufacturing as a millwright, in sales, and inside every type of plant you can name. Every feature in Weever exists because a plant needed it, including how forms are built, accessed, and acted on the floor. That's why the platform works the way your teams actually operate.
Designed for every level of your operation
When you digitize your paper forms in Weever, the data they capture works for everyone. Frontline operators get simple forms they can complete without slowing down. Supervisors get clear visibility into what's open and what needs attention. Plant and regional leaders get real-time performance data across every line, shift, and site. Everyone has what they need in one system, without anyone having to pull it together manually.
Live in weeks, not months
Weever can help you get your first paper-based program up and running in 4 to 5 weeks. Our implementation team builds your first process, so all you need to do is review it, give feedback, and go. We handle setup and configuration, and because Weever mirrors the processes your team already follows, there's very little to learn. Your champion and power users get up to speed in a short training session, and operators pick up what they need directly on the floor. IT involvement is minimal — there's no app to download, no user lists to manage, and no extra infrastructure to set up. Once you're live, a dedicated team stays with you through every program and site you add next.
Ready to digitize your paper forms?
Ask us to build one of your paper forms in Weever so you can see exactly how it works for your plant.

Paper Logs vs Electronic Logs in Manufacturing: Should You Make the Switch?
If you're considering switching from paper logs to electronic logs in your manufacturing plant, we know this is a big decision.
After all, paper is familiar. You've already designed forms, binders, and other tools for capturing essential information, the team knows the routine, and programs run according to the processes you've put in place.
But you also know paper has a cost. It shows up in the hours you spend on admin instead of on the floor, the audit findings that keep coming back because corrective actions never actually close, and the days spent hunting for records scattered across binders, clipboards, and spreadsheets.
That's why we put together this article. We'll walk you through the real cost of paper logs, what the right electronic log system actually delivers, and what switching looks like, so you can make the right call for your plant.
How paper logs and electronic logs compare in manufacturing
The choice between paper logs and electronic logs might seem like a minor operational detail. But how you capture and manage information across your programs affects everything from daily floor visibility to audit readiness. Here's how the two approaches stack up across six areas that matter most to manufacturing operations leaders.
Paper Logs vs. Electronic Logs
Data capture at the point of work
When plants rely on paper-based systems, operators often record data away from the point of work — filling in forms, initialing boards, or completing packets at a central location or from memory at the end of a shift. No matter how the information is captured, it ends up scattered across formats, making it impossible to see the full picture or take the right action.
With the right electronic system, operators scan a QR code at the workstation to pull up the correct digital form on any shared device. The log is created at the point of work, and supervisors can see the information that was submitted the moment it happens, without waiting for binders to come back at the end of the shift.
Error log potential
Paper logs create two error points. The first occurs at the point of capture, where operators can skip fields, create difficult-to-read entries, or accidentally damage records in wet production environments. The second happens during transcription, when someone re-enters that handwritten data into a spreadsheet or report. That two-step process is where errors compound. And when errors accumulate across shifts and weeks, they surface as audit findings, signaling to regulators that your corrective actions aren't working.
In contrast, the right electronic system captures data once at the source, with required fields and validation rules that prevent submissions with missing or invalid entries. There is no transcription step required, so the data remains accurate from the moment it's recorded.
Information visibility across the plant and sites
With paper logs, information is buried across binders, packets, and whiteboards. Even when managers track down the data they need, it reflects what happened last shift or last week, not what's happening in real time. By the time anyone realizes there's a problem, it's often been occurring for days.
The right electronic system works differently. Completion data flows into live dashboards the moment teams record information, so plant managers and operations leaders can instantly see overdue tasks, trending deviations, or areas where programs are falling behind. That data can also feed directly into the reporting tools leadership already uses, so it doesn't create another system to check. The result is a single, real-time view of what's happening across every line, shift, and site without anyone having to compile a report.
Follow-up on flagged issues
When an operator flags an issue in a paper log, resolving it depends entirely on someone remembering to follow up. Someone might transfer it to a spreadsheet, mention it at the next handoff, or email a supervisor. But without a clear owner, due date, or reminder, it can sit unresolved for weeks — sometimes months — before anyone notices it hasn't been closed.
Compare that to the right electronic system, where corrective actions are automatically assigned a named owner, a due date, and follow-up reminders. Operations leaders can see which issues are open, who is responsible for resolving them, and how long they've been sitting without having to ask.
Scaling and standardization
When plants rely on paper logs, every new line, shift, or site that’s added requires printing more forms, maintaining more binders, and reconciling more spreadsheets. Every facility also tends to develop its own version of the same program, which means corporate leadership has no way to compare performance or govern programs consistently across the business.
However, the right electronic system lets you roll out a single standardized version of the program across every line, shift, and site without increasing administrative overhead. Corporate leadership can compare performance across facilities at any time, rather than waiting for each plant to manually compile reports.
Audit readiness
Before an audit, paper-based programs require days of manual assembly. The logs are often incomplete, illegible in places, or lacking the traceability an auditor needs. And because action items often don't close reliably on paper, the same findings come back cycle after cycle.
The right electronic system takes the scramble out of audit prep. Electronic logs automatically build audit trails as work happens, with every task timestamped and every corrective action tracked to closure within the same system. If an auditor asks about a specific issue on a specific date, the electronic logs provide that information down to the minute.
Why paper feels like the safe choice (and what that assumption misses)
Most manufacturing plants use paper logs because that's how it's always been done. Switching can feel like an unnecessary risk when programs are already running.
But staying on paper isn't as safe as it seems. On the surface, paper-based systems appear to run smoothly, but the reality on the floor often differs. As we've mentioned, paper-based systems have inherent challenges: operators record information away from the point of work, corrective actions often go unresolved, and records are incomplete.
In fact, the gap between paper logs and reality on the floor is often larger than it appears because individuals find workarounds for known issues. For example, supervisors might tape laminated sheets to equipment listing steps the MSS doesn't cover, pass instructions verbally at handoffs that never make it into any official record, or even keep handwritten notebooks to record details the official forms don't capture. These informal systems work until the supervisor who built them leaves, or until an auditor asks for documentation that exists only in someone's personal records or memory.
What paper-based manufacturing programs are actually costing your plant
Most manufacturing operations leaders we’ve worked with have never totaled the actual costs of their paper-based programs, so they’re often surprised to see the numbers. Here's where the expenses add up:
Manager and supervisor time lost to coordination
Sanitation managers who run Master Sanitation Scheduling (MSS) on paper spend an average of 933 hours a year (roughly 23 working weeks) on the administrative work generated by the program, such as printing packets, collecting binders, chasing signatures, reconciling spreadsheets, and following up on corrective actions [Weever Sanitation Gap Report, 2026]. CI Managers, safety leads, and supervisors across your other programs absorb the same kind of overhead. And this prevents them from spending time on what they were actually hired to do: coaching operators, making process improvements, and catching problems early enough to prevent equipment downtime, failed audits, and product holds.
Errors and incomplete records create compliance exposure
When records are handwritten and later re-entered into spreadsheets, errors become easier to introduce and harder to catch. In regulated environments, those gaps can create compliance exposure. The risk is especially clear in two-step, paper-based calibration processes, where manual re-entry has been estimated to produce errors in roughly 40% of records.
Those errors can have costly consequences. In food manufacturing, incomplete or inaccurate records can lead to audit findings, product holds, rework, investigation delays, and, in the worst cases, recalls. When teams can’t quickly prove what happened, small recordkeeping gaps can turn into costly operational problems. In the U.S., the average food recall has been estimated at $10 million in direct costs alone, while 23% of companies in a GMA recall-cost survey reported recall-related financial impacts above $30 million. And the costs can hurt long before they reach recall scale. One food and beverage manufacturer we worked with was absorbing more than $200,000 a year in product holds before moving off paper.
Audit prep takes days, and the same findings keep coming back
Between pulling binders, reconciling spreadsheets, and chasing corrective actions that may or may not have been closed, audit prep typically takes 2 to 5 days every cycle. Teams can lose up to 40 hours each time an audit comes around, and then spend more hours fixing issues that should have been resolved previously.
Paper logs don’t scale across lines, shifts, or sites
The administrative burden of paper-based programs grows with operations. Every new line, shift, or site adds more forms to print, more binders to maintain, more spreadsheets to reconcile, and more variation in how the same program runs. At some point, someone's entire role can involve keeping the paper process running, which adds up in time and salary. But the harder cost occurs at the corporate level. Without standardization across sites, plant managers and corporate leadership can’t compare performance, identify best practices, or govern these programs consistently across the business. Every site runs its own version of the same programs, and nobody can determine what’s working, how to avoid repeating costly mistakes, or how to improve efficiency.
The cost of paper itself
In our experience working with mid-size manufacturing plants, most go through roughly 200,000 sheets of paper a year. When you factor in printing, controlled storage, and proper disposal, that adds up to around $60,000 annually — and that's before labor, delays, or rework enter the calculation. This cost has always existed, but something most plant leaders have never actually sat down to calculate.
Why paper feels like the safe choice (and what that assumption misses)
Most manufacturing plants use paper logs because that's how it's always been done. Switching can feel like an unnecessary risk when programs are already running.
But staying on paper isn't as safe as it seems. On the surface, paper-based systems appear to run smoothly, but the reality on the floor often differs. As we've mentioned, paper-based systems have inherent challenges: operators record information away from the point of work, corrective actions often go unresolved, and records are incomplete.
In fact, the gap between paper logs and reality on the floor is often larger than it appears because individuals find workarounds for known issues. For example, supervisors might tape laminated sheets to equipment listing steps the MSS doesn't cover, pass instructions verbally at handoffs that never make it into any official record, or even keep handwritten notebooks to record details the official forms don't capture. These informal systems work until the supervisor who built them leaves, or until an auditor asks for documentation that exists only in someone's personal records or memory.
What paper-based manufacturing programs are actually costing your plant
Most manufacturing operations leaders we’ve worked with have never totaled the actual costs of their paper-based programs, so they’re often surprised to see the numbers. Here's where the expenses add up:
Manager and supervisor time lost to coordination
Sanitation managers who run Master Sanitation Scheduling (MSS) on paper spend an average of 933 hours a year (roughly 23 working weeks) on the administrative work generated by the program, such as printing packets, collecting binders, chasing signatures, reconciling spreadsheets, and following up on corrective actions [Weever Sanitation Gap Report, 2026]. CI Managers, safety leads, and supervisors across your other programs absorb the same kind of overhead. And this prevents them from spending time on what they were actually hired to do: coaching operators, making process improvements, and catching problems early enough to prevent equipment downtime, failed audits, and product holds.
Errors and incomplete records create compliance exposure
When records are handwritten and later re-entered into spreadsheets, errors become easier to introduce and harder to catch. In regulated environments, those gaps can create compliance exposure. The risk is especially clear in two-step, paper-based calibration processes, where manual re-entry has been estimated to produce errors in roughly 40% of records.
Those errors can have costly consequences. In food manufacturing, incomplete or inaccurate records can lead to audit findings, product holds, rework, investigation delays, and, in the worst cases, recalls. When teams can’t quickly prove what happened, small recordkeeping gaps can turn into costly operational problems. In the U.S., the average food recall has been estimated at $10 million in direct costs alone, while 23% of companies in a GMA recall-cost survey reported recall-related financial impacts above $30 million. And the costs can hurt long before they reach recall scale. One food and beverage manufacturer we worked with was absorbing more than $200,000 a year in product holds before moving off paper.
Audit prep takes days, and the same findings keep coming back
Between pulling binders, reconciling spreadsheets, and chasing corrective actions that may or may not have been closed, audit prep typically takes 2 to 5 days every cycle. Teams can lose up to 40 hours each time an audit comes around, and then spend more hours fixing issues that should have been resolved previously.
Paper logs don’t scale across lines, shifts, or sites
The administrative burden of paper-based programs grows with operations. Every new line, shift, or site adds more forms to print, more binders to maintain, more spreadsheets to reconcile, and more variation in how the same program runs. At some point, someone's entire role can involve keeping the paper process running, which adds up in time and salary. But the harder cost occurs at the corporate level. Without standardization across sites, plant managers and corporate leadership can’t compare performance, identify best practices, or govern these programs consistently across the business. Every site runs its own version of the same programs, and nobody can determine what’s working, how to avoid repeating costly mistakes, or how to improve efficiency.
The cost of paper itself
In our experience working with mid-size manufacturing plants, most go through roughly 200,000 sheets of paper a year. When you factor in printing, controlled storage, and proper disposal, that adds up to around $60,000 annually — and that's before labor, delays, or rework enter the calculation. This cost has always existed, but something most plant leaders have never actually sat down to calculate.
How to decide if it’s time to switch from paper logs to electronic logs?
The cost of staying on paper is hard to argue with: hundreds of hours in admin, audit exposure, findings that keep coming back, and programs that can’t scale. For this reason, we don’t think there’s much of a debate. The real question isn’t whether to digitize. It’s whether you can do it without creating a bigger problem than the one you’re solving.
Why most digital manufacturing tools fail
Most digital tools are built on the assumption that your plant will adapt to the software. They come with preset templates and locked workflows that the developers think make sense, but miss the specific details that matter on your floor.
When generic tools can't accommodate those details, operators start pencil-whipping digital forms because the new process is slower than the one it replaced, and managers stop trusting the data because the system can't capture the context that mattered on paper. Eventually, the team abandons the software and reverts to the binders and spreadsheets they used before, or runs a parallel system that's harder to manage than either one alone.
A failed implementation doesn't just waste the license fee. It consumes months of management time, creates organizational fatigue, and leaves your team no further ahead than when you started. And because a failed digital rollout is visible to everyone, the next attempt is harder to get off the ground.
How to digitize your frontline without redesigning your programs
The good news is there's a version of digitization that doesn't require redesigning your processes or managing a massive transformation project. Instead of forcing your plant to conform to the software, you digitize your existing programs exactly as they are — with the same frequencies, workflows, scoring criteria, action-item process, and more. The only thing that changes is how your team captures information.
McKinsey research shows manufacturers implementing digital tools see 15% to 30% improvements in labor productivity. Here’s what implementing the right software looks like in practice:
- View data in live dashboards the moment work happens, so supervisors can act on today’s problems instead of last week’s
- Capture information once at the source with validation rules, so there’s no transcription step and no illegible entries to chase down later
- Create corrective actions automatically, assign them to an owner, and track them through to closure, so the same findings stop coming back
- Roll out one standardized program across every line, shift, and site without rebuilding from scratch each time
3 signs it's time to make the switch
In our experience, the decision to move off paper typically happens when a new site manager joins and doesn't want to spend their time the way their predecessor did. But the signs that it was time to switch were usually there long before that.
- Managers spend more time coordinating paperwork than improving programs. When the people responsible for sanitation, safety, and equipment reliability spend their days printing packets, chasing signatures, and reconciling spreadsheets, they're not doing what they were hired to do.
- Audit prep takes days, and the same findings keep coming back. If your team spends a week pulling records together every audit cycle and the corrective actions from the last audit still aren't closed, you don’t have the right system in place.
- You can't see what's happening across every site without asking someone to compile a report. When every site runs its own version of the same program and numbers only come together manually, there's no way to proactively identify gaps before they become problems.
If more than one of these issues sounds familiar, the next step is making sure the system you switch to is built to fit how your plant actually runs.
What digitizing your existing paper programs looks like with Weever
If you decide to move from paper to electronic logs, getting up and running can be simpler than most manufacturing leaders expect.
That’s why we built Weever, a connected worker platform designed to digitize your frontline programs without changing how they work. Your frequencies, workflows, scoring criteria, action-item process, and anything else you've put in place stay intact, so the transition doesn't require you to adopt someone else's version of how your plant should operate.
Sanitation, safety, 5S, and AM — digitized as they already run. Here’s what changes when you digitize your programs with Weever:
- Sanitation (MSS): Schedules, task assignments, and data verification all live in one place, giving sanitation teams a fully paperless sanitation log that’s always audit-ready. Operators scan a QR code at the workstation to pull up what needs to get done, and supervisors see completion rates in real time instead of compiling them after the fact.
- Safety (BBSO): Operators submit observations from any shared device in seconds. Action items get assigned automatically, and closure rates become visible across the organization.
- 5S Audits: Audits run faster than the paper version they replace. Scoring criteria sit inside the form, and open issues get tracked through to closure.
- Autonomous Maintenance (AM): Operators capture CIL and centreline checks at the equipment with photo evidence. Defects flow into the same reporting view leadership already uses.
The same frontline process, just faster and more reliable
What doesn't change during digitization is the process itself. Operators follow the same steps they always have, just in a digital workflow instead of on paper. Most plants are up and running in weeks, and because the programs look and feel familiar from day one, adoption happens quickly.
Built to integrate with the manufacturing systems you already use
If your plant has already invested in SAP, a CMMS, an OEE platform, or a QMS, Weever connects directly to those systems. Action items flow into SAP work orders, completion data feeds into Power BI dashboards, and defects sync with your CMMS. Weever sits alongside the enterprise stack your plant already relies on, rather than competing with it.
Results from manufacturers that have made the switch from paper logs to electronic logs
We’ve worked with leading manufacturers across sanitation, safety, 5S, and AM to help them transition from paper-based systems to electronic data collection without disrupting how their plants already run. Here’s what changed for them.
Master Sanitation Schedule (MSS)
Mars Fort Smith’s sanitation department reached a 100% completion rate for all tasks site-wide after implementing Weever. The site also achieved an 89% completion rate for abnormalities addressed and corrected to date, demonstrating how automated workflows helped improve follow-through beyond sanitation alone.
Safety (BBSO)
Baywater Pipeline went from struggling to get frontline workers to submit safety observations to a 230% increase in monthly submissions after digitizing with Weever. A Fortune 100 CPG manufacturer saw a 500% increase in BBSO participation across 10 focused behavior categories, with more than 6,000 submissions in a program that had previously stalled.
5S Audits
Adient, an automotive parts manufacturer, digitized its 5S audits and saw plantwide scores climb from 85% to 97%. Open issues dropped from more than 60 per month to fewer than 5, and the audit team recovered about four hours a week on administration. The program was running plantwide in under three months.
Autonomous Maintenance (AM)
A global CPG manufacturer’s AM program was consuming 30% of the Maintenance Manager’s day in admin before digitization. After moving inspection workflows to Weever, participation climbed more than 500%, with 3,000+ 5S, CIL, and centerline reports completed in the first eight months. Automated reporting also gave the Maintenance Manager back 30% of his day.
Getting started: How to digitize without disrupting production
Most manufacturing leaders we work with start with a single program at a single plant. We built the following ADAPT framework to help them get up and running quickly while minimizing disruption to existing operations.
A - Assess the current reality.
Before configuring anything, we work with you to understand how your program actually runs on the floor. That means understanding what your operators need in the flow of their work, what supervisors need to see without having to chase people down, and what managers need to make decisions without drowning in manual data entry.
D - Digitize what already works.
We digitize your existing forms and routines exactly as they run today, so operators follow the same process they already use. Supervisors and managers gain structure and consistency without change-management headaches.
A - Align the solution to real conditions.
We configure Weever to match your plant’s reality. Operators access digital forms instantly, conditional logic shows only the fields they need, and real-time dashboards give everyone clear visibility into completion status and follow-up needs. The system feels natural on the floor and useful in daily management.
P - Prepare the team for quick adoption.
We start with one high-impact program, usually the one causing the most pain, configure it to match how your team already works, and get people using it within weeks. From there, the success builds momentum for the next program.
T - Tune and improve continuously.
Once your team is using Weever consistently, the focus shifts to continuous improvement. Real-time data shows you exactly where to streamline, where to coach, and where to invest. Because Weever connects the work on the floor to the systems that report on it, you get a continuous cycle of refinement based on what’s actually happening in your facility.
By the end of the process, your plant is running the same programs it always has, just faster, with cleaner data, and without the admin burden that comes with paper.
Make the move from paper logs to electronic logs in your manufacturing plant
Discover what an electronic log system for your sanitation, safety, 5S, or AM programs could look like. We'll digitize part of your existing paper process in Weever as-is, so you can see exactly how simple the transition can be.
How to Prevent Food Product Recalls in Manufacturing
How to Prevent Food Product Recalls in Manufacturing
A Practical Guide for Sanitation & Quality Managers
If you're like most quality and operations leaders we talk to, you've already taken the right steps towards preventing food product recalls. Things like documenting your HACCP plan, keeping your Master Sanitation Schedule (MSS) up to date, and maintaining your SSOPs.
But having the right documentation in place doesn't always mean you can tell whether your team is executing those programs correctly on the floor — especially your MSS, where the volume of daily sanitation work makes execution gaps the hardest to see.
This gap is where food recall risk grows and where some of the biggest opportunities to prevent it are hiding in plain sight.
Understanding the hidden gap in traditional food recall prevention
When you've put the right food safety programs in place, it's natural to assume your team has everything they need to get their work done and prevent a recall from happening. But in practice, executing them consistently — particularly the daily MSS work — is a lot harder than it looks:
- Supervisors spend time chasing signatures instead of managing sanitation
- QA can’t verify completion without walking the floor
- Teams log deviations, but don’t reliably tie them to closure
- CAPAs live in a separate spreadsheet or email chain, disconnected from the MSS
- Operators fill in records after the shift rather than at the point of work
- Audit prep requires reconstructing logs across paper, spreadsheets, and handoffs
- Different shifts or sites execute the same SSOPs differently
When these issues show up, most teams blame the program. But in our experience, that’s usually the wrong diagnosis. These aren’t signs of a bad program or a bad team. They’re what happens when the only tool available to manage sanitation execution is paper.
Paper can record when someone completes a task, but it can't confirm when, by whom, or whether the work actually met the standard. And that’s the gap manual systems can’t close.
For sanitation managers, it’s usually clear that the paper-based system is broken. But for plant and regional leadership, it’s not apparent, typically because binders, printed packets, and weekly spreadsheet updates create the appearance that everything is under control. By the time the gap becomes visible — through an audit finding, an environmental positive, or a recall — the opportunity to prevent it has already passed.
That's why the steps in this guide focus on closing the gap between your MSS and what's actually happening on the floor.
6 preventable food contamination & recall risks that start on the plant floor
There are six ways the gap between a documented MSS and executing it shows up on the plant floor. Understanding where food recall risk actually originates — and why it stays hidden — is the first step to preventing it.
Risk 1: Cleaning failures remain hidden until after the shift ends
In most food manufacturing facilities we work with, operators run sanitation on a schedule — working through the tasks, signing the log, and moving on. The problem is that completing the tasks and meeting the SSOP standard are two different things. Without real-time verification, there’s no way to confirm the cleaning actually met the standard. But by the time a supervisor reviews the log, the shift is over, production has started, and any cleaning failure that occurred has already carried forward.
Salmonella, E. coli, and Listeria most often trace back to product-contact surfaces where the crew signed the log but didn’t meet the standard. And that gap stays invisible until an auditor or test result surfaces it.
Why this risk is preventable
Cleaning failures stay hidden in paper-based systems because verification happens after the shift, not during it. When teams can capture photo and timestamp evidence at the point of work — and supervisors can see task completion status in real time without walking the floor — issues surface during the shift, when there’s still time to act.
Risk 2: There’s no proof that changeover cleaning meets the allergen SSOP standard
Undeclared allergens and mislabeling accounted for 45.5% of all U.S. food recalls in 2024 at an estimated cost of $1.92 billion. A meaningful share of those undeclared-allergen recalls trace back to changeover cleaning, where the failure almost always comes down to the same gap: the cleaning was scheduled, someone signed the log, but nobody can prove it was completed to the SSOP standard required to protect against allergen cross-contact.
When sanitation data is scattered across paper logs, spreadsheets, and verbal handoffs, there’s no single source of truth. An initial on a form confirms someone looked at the page, but not whether the work met the standard. And when teams reconcile documentation after the fact rather than capturing it at the point of work, that fragmented record rarely holds up in a recall investigation.
Why this risk is preventable
The challenge isn’t in the cleaning. It’s in the inability to prove the cleaning met the standard at the moment it happened. When teams can capture photo and timestamp evidence at each changeover step and tie that evidence to the specific SSOP task, a signed log becomes a defensible record rather than an assumption.
Risk 3: Equipment defects get flagged but are not confirmed closed before production starts
Most facilities run a pre-op inspection to confirm that sanitation was completed correctly — checking equipment, surfaces, and cleaning zones for anything that could create a food safety risk. Most of the time, pre-ops do catch issues. What they can’t reliably do is confirm that those issues were actually resolved before the line starts.
When someone flags a defect, such as a cracked gasket, a worn seal, or a conveyor belt that doesn’t look right, everyone moves on, assuming the issue will be resolved. The problem is that the inspection record and the repair completion confirmation often reside in different systems. For example, one could be in a form, and the other could be an email. Since nothing automatically connects them before production starts, this means the line starts on an assumption rather than a confirmation.
Why this risk is preventable
The gap between flagging a defect and confirming it’s resolved is a workflow problem. When you can keep the inspection record, the corrective action, and the verified closure in one connected system, production doesn’t start until the loop is closed.
Risk 4: Deviations carry into the next shift unresolved
When a team identifies a sanitation deviation during a shift, the intention is always to resolve it. In practice, the issue typically ends up logged on paper, mentioned verbally at the handoff, and tracked in a separate spreadsheet (if anyone tracks it at all). But by the time the next shift starts, there’s often no reliable way to confirm it was actually fixed.
The problem with this is that unresolved deviations carry over into the next production run, resurface across audit cycles, and create the pattern that regulators flag as a systemic failure. As one Sanitation Manager we worked with described it: “Our shadow systems are accurate, but our official schedule isn’t.”
Why this risk is preventable
Deviations only create recall risk when they go unresolved. When you have a system that automatically assigns ownership, sets due dates, and tracks closure, it can turn disparate documentation into a managed workflow where nothing gets missed.
Risk 5: Compliance records get reconstructed instead of captured
Not every recall begins with contamination. Some start with an FDA or GFSI inspection where the facility can’t prove GMP compliance — even when the sanitation work was done correctly. A record that can’t be verified creates the same compliance exposure as if the work had never been completed.
The physical environment makes this worse. In wet locations, foam, rinse cycles, and chemical overspray mean paper logs rarely survive the shift intact. So operators fill in records from memory at the end of the shift rather than capturing them at the point of work.
In a two-step paper process in which operators record task completion on paper, and a supervisor later re-enters it into a spreadsheet, roughly 40% of records contain errors before anyone reviews them. When auditors find reconstructed logs, bulk-initialed forms, or shadow systems that don’t match the official MSS, what starts as an audit finding escalates into regulatory action.
Why this risk is preventable
Execution inconsistency across shifts and sites is a visibility problem. When teams use digital tools to deliver the same instructions to every crew at the point of work — in their language, tied to the specific task — standardization no longer depends on who’s running the shift. And when leaders can see completion rates and deviation patterns in real time across all facilities, inconsistency becomes detectable before it becomes a finding.
The true cost of food product recalls in manufacturing plants (and why prevention pays)
Each of the six execution risks above carries a financial cost — one that begins to accumulate long before a food product recall occurs. Most manufacturing teams don't see the full picture because these costs don't show up in a single place. But understanding them is critical to making a case to fix them.
Before you can get buy-in for better recall prevention in your plant, you need to show what the current approach is actually costing you. Here's what that picture looks like.
The pre-recall costs you’re already carrying
Pre-recall costs are the financial losses that accrue before a recall occurs. Specifically, these include the day-to-day operational expenses that result from weak sanitation execution. Things like product holds, unplanned recleans, and the hours sanitation managers lose to manual record-keeping. Most plants absorb these costs without realizing it because they rarely show up as a single line item.
In our experience, product holds alone can run $15,000 to $20,000 each in food and beverage manufacturing. Unplanned recleans, ordered when sanitation records don't match floor conditions, consume crew labor, chemicals, and production time, even when the cleaning was done correctly. And sanitation managers lose an average of 933 hours per year — roughly 23 working weeks — to manual MSS administration: scheduling, chasing signatures, reconciling spreadsheets, and assembling audit binders. Check out Weever's Sanitation Gap Report 2026
The direct costs food product recalls can trigger
Direct costs are the immediate, visible expenses a recall triggers the moment it happens. Unlike pre-recall costs, these are hard to miss and much harder to contain.
A long-cited GMA/Food Marketing Institute study estimated that the average food recall costs U.S. companies approximately $10 million in direct costs alone, including expenses such as retrieving and disposing of recalled product. That figure does not include indirect costs like lawsuits, brand damage, lost sales, or reputational harm. And that’s only the baseline. In a GMA recall-cost survey of food, beverage, and consumer product companies, 23% of respondents who had faced a recall in the previous five years estimated that the total financial impact exceeded $30 million. Recent recall activity shows why that exposure still matters: U.S. PIRG Education Fund counted 296 FDA and USDA food recall announcements in 2024, while Sedgwick reported that USDA-regulated food recalls accounted for 37.1 million pounds of product in Q1 2026, the third-highest quarterly total in more than two decades.
The indirect food recall costs that are harder to quantify and harder to recover from
Indirect costs are the longer-term financial and reputational consequences that follow a food product recall, and they’re often harder to measure than the immediate costs of retrieval, disposal, and remediation.
Beyond the direct cost of executing the recall, companies may also face business interruption, lost profits, liability claims, customer losses, public relations costs, and long-term reputation damage. In GMA’s recall-cost survey, respondents identified brand protection as one of their biggest concerns after consumer safety, and the report notes that damage to a brand or company's reputation is difficult to quantify and challenging to recover from financially.
Besides the financial impact, there's a human cost. Nearly 1,400 people became ill from recalled food in 2024, with 98% affected by just 13 outbreaks — a reminder that execution gaps carry consequences beyond a spreadsheet.
Add these three cost categories together, and the real cost of weak recall prevention is clear, well before any food recall occurs. For most plants, the decision isn't the cost of prevention versus doing nothing. It's the cost of better prevention versus the cost of continuing to absorb losses that are already accumulating.
How manufacturers can close MSS execution gaps to shift from reactive to proactive food recall prevention
Most of the costs mentioned above are largely preventable. The four steps below address how to reduce them. Specifically, they show how to close the six execution gaps identified earlier through real-time sanitation verification, deviation closure before the next shift starts, and audit trails that build themselves without reconstruction.
Step 1: Align your MSS with how sanitation actually runs
Before you can close execution gaps on the floor, your MSS needs to reflect how sanitation actually runs in your facility. Digitizing an inaccurate schedule won’t solve the problem. It will just make the errors easier to spot.
Common issues we see include:
- Tasks that reference equipment that's been moved or replaced
- Cleaning frequencies that were set years ago and never validated against the current contamination risk
- SSOPs that exist as documents in a binder rather than instructions accessible at the point of work
When instructions aren't in front of the right crew member at the right moment — in their language, embedded in the task itself — standardization breaks down regardless of how well you've documented the schedule.
Since the MSS is the first document GFSI and FDA auditors request — and the first place they look for compliance gaps — any inaccuracies in it create immediate exposure on top of the execution gap on the floor.
A practical test
Could a new sanitation crew member complete every MSS task correctly, to the required SSOP standard, using only the instructions your system provides at the point of work? If the answer is no, your MSS isn't structured to enable consistent execution.
Step 2: Verify sanitation task completion in real time, not at pre-op inspection
Shifting from reactive to proactive food safety means verifying sanitation as it happens, not hours after the fact. Most food safety failures and environmental positives in food manufacturing don't stem from a missing Master Sanitation Schedule. They stem from equipment cleaning that happened, but was never confirmed to standard before production started.
Real-time verification means photo and timestamp evidence captured at the point of work, task completion status visible without walking the floor, and deviations flagged early enough for teams to act. ATP testing and environmental pathogen monitoring are still valuable, but they confirm contamination after the fact rather than prevent it. Catching GMP failures before contamination occurs requires verification during production, not after it, and that's not something paper-based systems can deliver.
A practical test
Your QA or FSQA Manager should be able to confirm whether any room in your facility was cleaned correctly on any given shift, without walking the floor or waiting for binders. If the answer is no, you need a digital verification system that captures task completion at the point of work and makes that status visible in real time across all rooms and shifts.
Step 3: Close sanitation deviations and CAPAs before they carry over to the next shift
Most plants identify sanitation deviations, but far fewer have a reliable system for closing them. When teams log a deviation on paper, mention it verbally at handoff, and track it in a separate spreadsheet — if they track it at all — nothing guarantees resolution before the next shift starts. The same issues resurface across audit cycles because nothing ties the deviation to its closure.
To break that cycle, every deviation needs a named owner, a defined due date, automatic escalation if it goes overdue, and verified closure that traces back to the original deviation in a single record. The same applies to equipment defects flagged during pre-op inspections. The inspection record, corrective action, and confirmation that the repair is complete all need to live in one system. When those pieces are scattered across forms, binders, emails, and spreadsheets, production can start on an assumption rather than a confirmed fix.
The clearest way to know whether that cycle is actually breaking is to track your CAPA closure rate — the percentage of identified deviations that reach verified resolution. If that number isn't visible, you can't tell whether your team is correcting GMP failures or just documenting them.
A practical test
Pick any deviation logged in the last 30 days. Can you confirm right now whether it was resolved, by whom, when, and what the corrective action was? If the answer requires asking someone, digging through multiple binders, or tracking down the right spreadsheets, you need a digital system that automatically assigns ownership, tracks closure, and links every deviation to its resolution in one place.
Step 4: Build a sanitation audit trail that holds up without reconstruction
If your team spends days before every audit reconstructing logs and reconciling records across binders and spreadsheets, the audit trail isn’t happening in real time. Audit-ready, paperless sanitation records should be a byproduct of normal MSS execution, not a separate project that only kicks off when an auditor books a visit.
What makes a sanitation audit trail defensible is actually quite simple:
- Every task should be timestamped and attributed to the person who completed it
- Task sign-offs should be digital, controlled, and traceable
- Any changes should preserve the original record and show who changed what, when, and why
- SSOP verification should be tied to specific sanitation completions
- Deviations, corrective actions, verification steps, and closure should be connected in one place
Digital sanitation records are easier to defend when they’re built with controls paper can’t provide: user-specific sign-offs, timestamps, restricted access, and a clear record of any changes. When electronic records are used to meet FDA recordkeeping requirements, 21 CFR Part 11 may apply, which is why a locked, user-attributed digital record is harder to challenge than a binder of bulk-initialed forms. FDA’s Part 11 guidance says the rule applies to electronic records maintained under FDA recordkeeping requirements, and the regulation includes controls for secure, reliable electronic records and electronic signatures.
FSMA’s Food Traceability Rule is the clearest example of where food safety recordkeeping is headed. The rule applies to companies that manufacture, process, pack, or hold foods on the FDA’s Food Traceability List. Specifically, it requires them to maintain Key Data Elements at Critical Tracking Events and to provide requested traceability information to the FDA within 24 hours or another reasonable timeframe agreed to by the FDA. The FDA has proposed extending the compliance date to July 20, 2028, and Congress has directed it not to enforce the rule before that date.
Although the rule is not specifically about sanitation records, it reinforces the broader direction: food safety records need to be structured, searchable, and ready to produce quickly. Facilities that build digital sanitation records now will be better positioned when auditors, regulators, or internal teams need proof of what happened, who completed it, and when.
A practical test
Ask your team to produce a complete sanitation compliance report for any room, any shift, any date in the last 90 days. How long does it take? If the answer is hours or days rather than minutes, look for a digital system that automatically builds the audit trail, turning audit prep into a minutes-long retrieval rather than a multi-day reconstruction.
How a digital MSS program makes food recall prevention possible
The four steps above outline the specific changes your manufacturing facility needs to make to shift from a reactive to a proactive approach to food recall prevention. But what you need to make this possible is a digital sanitation program that captures execution at the point of work, without disrupting how your teams operate. That's exactly what Weever, our connected worker platform, was built for. Here's what it looks like across your operators, supervisors, and leadership team.
Enhance your existing MSS program without changing your processes
Weever doesn't require you to redesign the food safety processes that are already working in your plant. The same tasks, cleaning frequencies, and SSOP structures can stay in place. What changes is how your operators, supervisors, and leadership team interact with them.
At the frontline operator level, QR codes on rooms or equipment pull up the correct sanitation task and SSOP instructions instantly on shared devices — in the crew's language, with visual guidance embedded at the point of work. At the supervisor level, a live dashboard shows task completion status by room, shift, and crew in real time, so deviations surface during the shift rather than at pre-op the next morning. And for regional and corporate leadership, a single real-time view surfaces execution data from all facilities, eliminating the need to assemble reports manually.
The result: the gap between what's documented and what's actually happening on the floor finally closes. And the programs already in place become more verifiable and more defensible.
Integrate with your existing food safety systems
One of the most common concerns quality and operations leaders raise when evaluating any new platform is whether it will create a data silo. Nobody wants another system that produces its own version of the truth and doesn’t connect to what leadership already uses.
Weever doesn’t replace your existing systems. It fills the execution gap they were never designed to close.
Specifically, Weever integrates with the QMS, ERP, CMMS, and SAP systems you already have in place via APIs and webhooks. This allows sanitation execution data to flow into the enterprise reporting tools you already rely on, rather than sitting on a separate platform. Power BI templates also connect Weever data directly into existing dashboards — putting MSS completion rates, CAPA closure trends, and deviation frequency alongside production and quality metrics in a single view, without manual exports or duplicate entry.
What improves when you can measure sanitation execution in real time
Connecting your sanitation execution data to your existing reporting systems does more than eliminate data silos. It gives your team something most paper-based programs never could — visibility into whether your MSS program is actually working before something goes wrong.
Most facilities can track metrics that tell them what went wrong, but not what's about to. By the time audit findings, environmental positives, and recall events appear, the execution failure has already happened, and the window to prevent it has closed. That's where leading indicators come in:
- MSS task completion rates by shift, room, and crew tell you whether sanitation is actually happening according to schedule
- CAPA closure time and rate by deviation type tell you whether identified failures are being corrected or just documented
- Sanitation deviation frequency by equipment and cleaning zone reveals where recurring problems are building before they escalate
- Pre-op inspection pass rates by production line show whether sanitation consistently meets the standard required to start production
When those metrics are visible in real time, your FSQA Manager can pull up this week's completion trends, spot a rising deviation rate in a specific zone, and act on it before the pre-op or the next audit, while there's still time to intervene.
Weever customers who have made this shift from paper-based systems to digital tracking see results quickly:
- Mars Fort Smith achieved 100% MSS task completion across all sanitation tasks managed through Weever.
- Monin saved 3 to 4 hours per day on manual data management and reporting across their Weever programs, including sanitation workflows. On the strength of those results, the company also expanded Weever implementation from a single facility to all North American sites in five months.
- Another food and beverage manufacturer went from one to two PCQI holds per period to zero after implementation, avoiding more than $200,000 in annual costs.
Those results aren't outliers. They're what happens when the right metrics become visible before a food safety failure forces them into view.
Take the next step toward proactive food recall prevention
If your manufacturing facility is susceptible to any of the risks described in this guide, Weever can help. Our connected worker platform digitizes your existing MSS, closes deviations before the next shift starts, and builds an audit trail automatically as work happens. Together, these capabilities give your team the visibility and control needed to prevent food product recalls before they happen — all without redesigning the processes already working in your plant.
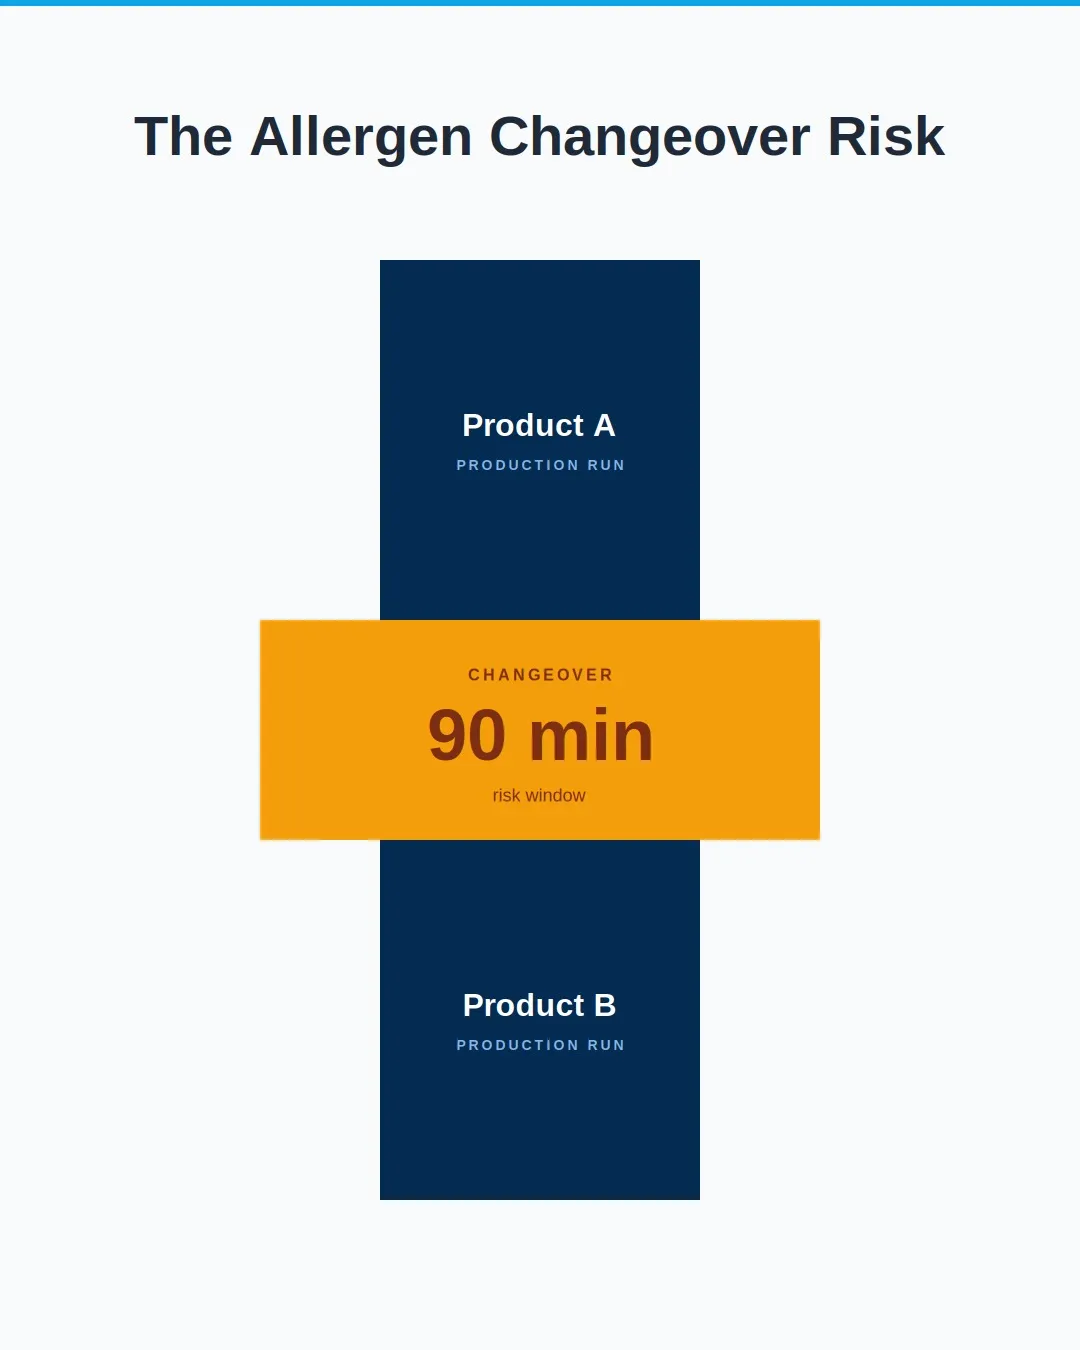
The Allergen Changeover Risk: Why Paper Verification Fails
Then comes the changeover.
A line that was running a peanut-containing product an hour ago will be running a peanut-free product in a few hours. A shared piece of equipment that just handled wheat needs to be ready for a gluten-free run. The clean is documented, the sign-off is collected, the line restarts.
In that changeover, your plant compresses more food-safety risk than the rest of the shift combined. If it's done wrong, you don't find out from a deviation log. You find out from a recall.
The risky economics of allergen changeover
Undeclared allergens are the single most common cause of food recalls in North America. They consistently top the FDA's Reportable Food Registry data and represent the largest share of Class I recall — the category reserved for products that pose a reasonable probability of serious adverse health consequences or death.
Recalls can happen to anyone, from Whole Foods to Kroegers, and the costs are significant. The average cost of a recall to a food manufacturer can be more than $10M+, before counting brand damage, lost shelf space, or the cost of regulatory scrutiny that follows. Most of those events trace back to one of two things: a mislabeling error, or an allergen cross-contact event during changeover.
The mislabeling problem is mostly an artwork-and-packaging problem. The cross-contact problem is a sanitation execution problem. And it's the one that gets the least technology investment.
Why paper-based allergen verification quietly fails
Walk through any food plant in North America and watch how an allergen changeover gets verified. The pattern looks something like this:
- The sanitation crew completes a wet clean per the SSOP.
- A supervisor walks the line with a clipboard and checks visual cleanliness.
- Someone runs an ATP swab. The reading is written on a log.
- A pre-op inspection form is signed, dated, and dropped in a binder.
- The line is released to production.
Every step in that sequence is defensible. The problem is what the sequence doesn't catch:
- The sign-off doesn't mean the work was done - A signature on a checklist is a record that someone said the work was done. It is not evidence that the work was done. The auditor knows this. The QA manager knows this. The signature is a legal artifact, not a verification.
- The ATP reading is a single data point, not a trend - A swab passes or it fails. What you can't see on paper is the trend on that specific contact point across the last 20 changeovers. Was this site historically a problem? Is the trend getting worse? Paper makes every changeover feel isolated when it should feel like a controlled variable.
- The deviation handoff is fragile - When something fails — a swab comes back hot, a visual inspection finds residue — the corrective action depends on a supervisor finding the right person, communicating the right context, and ensuring the rework is documented. On a busy shift, in a noisy plant, with a production line waiting, that handoff is exactly where things go wrong.
- The audit trail isn't an audit trail - It's a stack of paper in a binder. When the auditor asks for last quarter's allergen verification records for a specific line, somebody is digging. When the answer takes 20 minutes instead of 20 seconds, the auditor draws their own conclusions about how the program is actually run.
The cost of a paper-based allergen program isn't the paper. It's the audit findings, the rework, and the recall risk that builds up quietly between audits — and only surfaces when it's too late to do anything about it.
What the SQF and BRCGS auditors are actually looking for
Major food-safety standards — SQF, BRCGS, FSSC 22000, and the FSMA Preventive Controls Rule — all require a documented allergen management program. They all require evidence of verification. And they're all getting more sophisticated about what evidence looks like.
The bar five years ago was: can you show me the records?
The bar today is closer to: can you show me the records, the trends, the deviations, the corrective actions, and proof that someone reviewed them in a timely way?
Paper struggles with the first question. It fails the second.
This is why the most progressive food manufacturers are moving allergen verification out of binders and into digital MSS platforms that you can trust, shift after shift.
What a strong allergen changeover program looks like
A modern allergen changeover program — whether you run it through Weever or another digital platform — should be doing four things at once:
- Schedule the right work at the right time. Every changeover should trigger the right SSOP for that specific allergen transition, in the right sequence, with visual references for the operator. No ambiguity about which clean is happening today.
- Capture proof of cleaning in real time. Digital signatures, timestamps, ATP readings, and photo evidence — captured at the point of work, not transcribed afterward. The record exists because the work happened, not because someone wrote it down later.
- Catch deviations the moment they happen. A failed swab or a missed step should trigger a corrective action workflow immediately, with the right person notified, the rework documented, and the line release contingent on closure.
- Make trends visible. Every changeover is a data point. Over weeks and months, that data tells you which lines, which transitions, which shifts, and which sites need attention — before the audit finds them.
The bottom line
Allergen changeovers are the highest-risk recurring event in your plant. The control you have over them is exactly as good as the evidence you can produce for them.
If your allergen verification still lives in a binder, the question isn't whether your program is compliant today. It's how long that will hold.
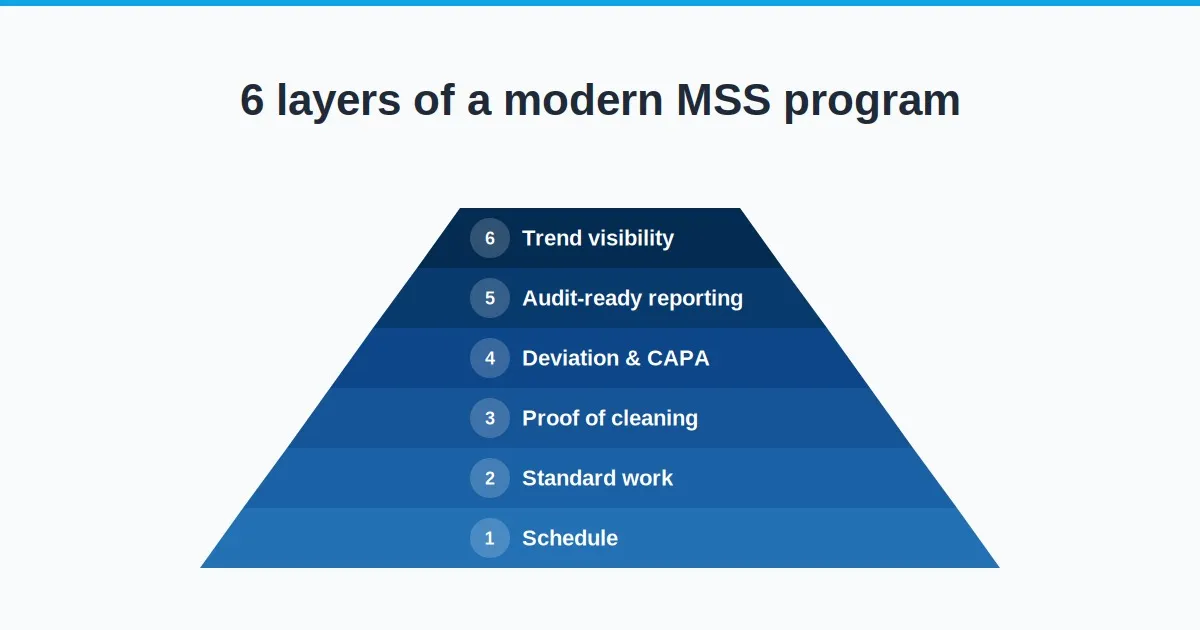
What Your Master Sanitation Schedule Stack Should Look Like in 2026
Sanitation in 2026 has changed. Auditors are sharper. Customers are demanding more documentation. FSMA 204 is coming.
According to The Master Sanitation Gap:
- 33% of sanitation managers say compliance is their #1 challenge
- 90% of plants still rely on paper to manage their sanitation programs
- 933 hours per manager, per year, lost to manual admin tasks
Those aren't abstract numbers. They're the gap between what a modern sanitation program is supposed to do and what most plants can actually prove on audit day.
If you're rebuilding your master sanitation program in 2026 (or just trying to figure out where to invest first) here's what a complete MSS stack should look like, and what each layer needs to do.
The 6 layers of a modern MSS stack
Think of your master sanitation program as a stack, each layer building on the one below it. Most plants are strong in the bottom one or two layers and thin everywhere else. The goal isn't to rip and replace; it's to know where the gaps are.
Layer 1: The schedule itself
The foundation. Every cleanable surface, every piece of equipment, every zone, every frequency, captured in one source of truth.
In a paper world, this is the 45-page packet. In a modern stack, it's a configurable schedule that:
- Auto-generates tasks at the right cadence
- Routes the right SSOP to the right operator at the right time
- Adapts when production changes (a line goes down, a SKU shifts, a zone is added)
- Doesn't require a person to reprint, re-distribute, or re-staple anything
If you want a primer on how to structure this layer from the ground up, Weever's Ultimate Guide to Food Plant Sanitation walks through it in detail.
Layer 2: Standard work and visual guidance
A schedule tells you when to clean. Standard work tells you how. In 2026, that means more than a printed SSOP in a binder.
A modern stack delivers:
- Step-by-step instructions on the device, in the operator's language
- Photo and video references for hard-to-clean surfaces
- Conditional logic (if this happened, do that)
- Versioning, so updates push to the floor the day they're approved
This is the layer that turnover hits hardest. When your most experienced sanitor leaves, the institutional knowledge has to live in the system, not in their head.
Layer 3: Proof of cleaning
This is where most paper programs lose the audit. The signature on the line is a record that someone said the work was done. It is not evidence.
A modern proof-of-cleaning layer captures:
- Digital signature, tied to a named user
- Timestamp at the point of work
- Photo evidence of clean surfaces at defined contact points
- ATP and allergen-specific test results, attached to the task
- Geolocation or zone confirmation where it matters
The shift here is subtle but important: the record exists because the work happened, not because someone documented it afterward. That's the threshold for what regulators and major retailers are now expecting.
Layer 4: Deviation and corrective action workflow
Things go wrong. A swab fails. A visual inspection finds residue. A step gets skipped. The question isn't whether deviations happen, it's whether they get caught, owned, and closed.
A strong CAPA layer:
- Triggers automatically when a deviation is captured
- Assigns an owner with a due date
- Blocks line release until the corrective action is verified, where appropriate
- Builds a trend over time, so you can see which deviations are recurring
The plants that pass audits cleanly aren't the ones with no deviations. They're the ones who can show, with one click, every deviation they've had this year and exactly how each one was closed.
Layer 5: Audit-ready reporting
This is the layer that pays back the investment fastest. The 933 hours of manual admin time per manager, per year — most of that is here. Compiling reports, transcribing logs into spreadsheets, hunting through binders for the specific records an auditor asked for.
Modern reporting should give you:
- Pre-built reports for SQF, BRCGS, FSSC 22000, and FSMA 204
- Filtering by date, line, area, shift, crew, or SSOP version
- Export to PDF, Excel, or directly to Power BI
- The ability to pull "every record for Line 3, last quarter" in seconds, not days
If an auditor asks for documentation and your team can produce it in minutes, the conversation that follows is very different from the one where someone disappears to dig through a filing cabinet.
Layer 6: Trend visibility and continuous improvement
The top of the stack. This is what separates a compliant program from a learning one.
Trend visibility means asking and answering questions like:
- Which contact points have the most failed ATP swabs this quarter?
- Which shift completes pre-op fastest, and why?
- Are deviations on Line 4 trending up since we changed the chemical?
- Which sanitor consistently catches issues others miss?
- Where are we actually getting better, and where have we stalled?
This is the layer that's missing from almost every paper-based program, because you can't analyze a binder. The shift to digital MSS isn't really about replacing paper. It's about unlocking this layer.
Where to start if your stack has gaps
Most plants don't need to rebuild everything at once. The teams that get this right tend to follow a sequence:
- Benchmark where you stand. Download The Master Sanitation Gap to see how your program compares to peers across North American food manufacturing on compliance posture, technology adoption, and admin burden.
- Map your stack. Walk the six layers above and rate each one honestly. Most plants are 4/5 on Layer 1, 2/5 on Layers 3 and 4, and 0/5 on Layer 6.
- Fix proof of cleaning first. Layer 3 is where audits get won or lost, and it's the layer where digital tools deliver the fastest, most visible improvement.
- Pilot one line. Pick your highest-risk line, digitize the full stack for that line, and run parallel to paper for a month. Compare the records.
- Build the dashboard before you expand. If the data you're capturing digitally doesn't answer trend questions, redesign before rolling it out plant-wide.
The bottom line
A modern master sanitation stack isn't a binder, a spreadsheet, or a single piece of software. It's six layers working together — schedule, standard work, proof, CAPA, reporting, and trend visibility — each one producing evidence the next layer depends on.
Paper can carry the first two layers. It struggles with the next two. It can't deliver the last two.
If your program in 2026 still depends on paper for the layers above Layer 2, you're not behind — you're with the 90% of plants the survey caught. But the audit environment is moving. The compliance bar is rising. And the manufacturers pulling ahead are the ones building the full stack.
Ready to see what your stack could look like? See how Weever’s Master Sanitation Schedule software delivers all six layers in one platform.
Spend Less Time on Admin. Get More Insights by Email.
Subscribe to receive practical tips, updates, and ideas to improve operations without the extra admin work.