
How to Optimize Autonomous Maintenance in Manufacturing with Weever
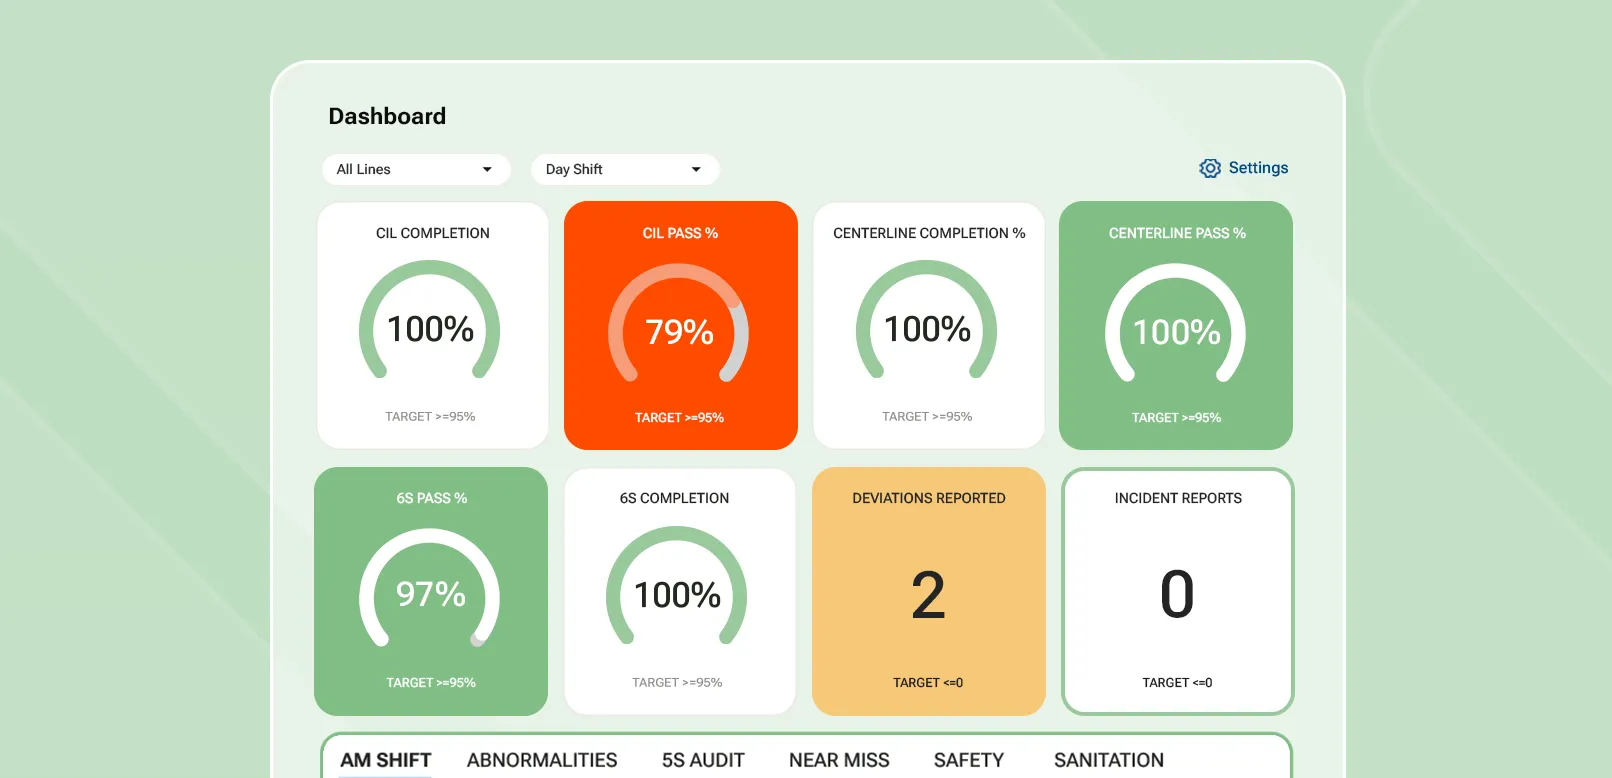
Table of contents

Share:


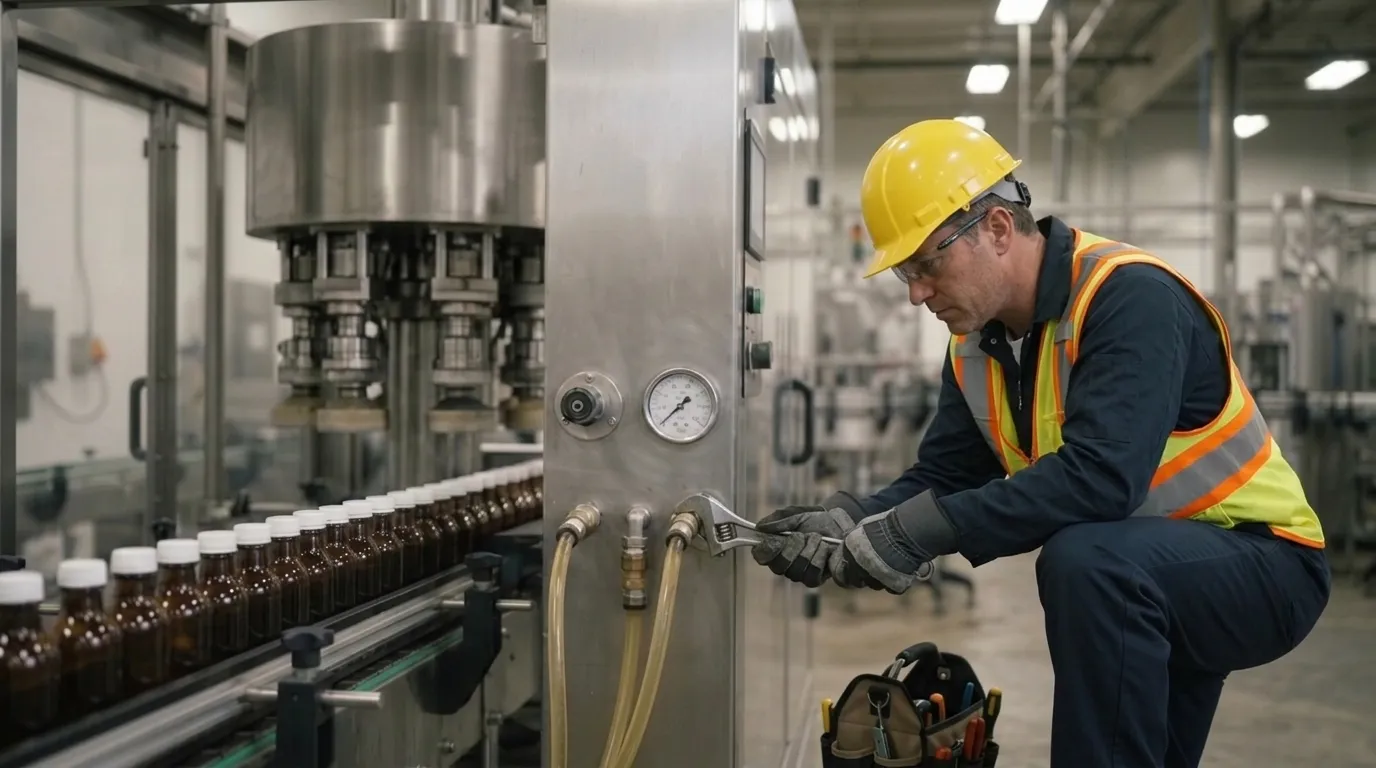
If you're running an Autonomous Maintenance program, you already know how it works. Operators clean, inspect, and lubricate (CIL) their own equipment. They catch abnormalities before they become breakdowns, centerline equipment and perform 5S audits. As a result, technicians get freed up for planned, higher-value work and operators become more engaged and productive.
The theory is solid. The execution is usually where it falls apart.
CILs get pencil-whipped at the end of a shift. Centerline readings get logged from memory instead of the gauge. Abnormality reports go into a binder nobody opens again. Your completion report says 100%, but a quick walk around the floor tells another story.
Done right, AM is one of the highest-ROI programs a plant can run. Done on paper, it stalls out within a year, one more binder gathering dust in the maintenance office. The difference isn't effort. It's whether the system your team uses actually captures what's happening, acts on it, and turns it into something you can learn from.
That's the loop we'll walk through here: Capture, Act, Analyze. It's the same cycle underneath every Weever program, and it's what turns AM from a checklist exercise into a program that enables continuous improvement and actually moves OEE (Overall Equipment Effectiveness).
What Is the Weever Loop and Why Does AM Need It?
Most AM programs break at the same three points. Data gets captured, but nobody trusts it. Issues get reported, but they don't get resolved. And even when the data is accurate and the issues do get closed, it's scattered across paper logs, spreadsheets, and tribal knowledge, so nobody can see the pattern until it's already cost you a line.
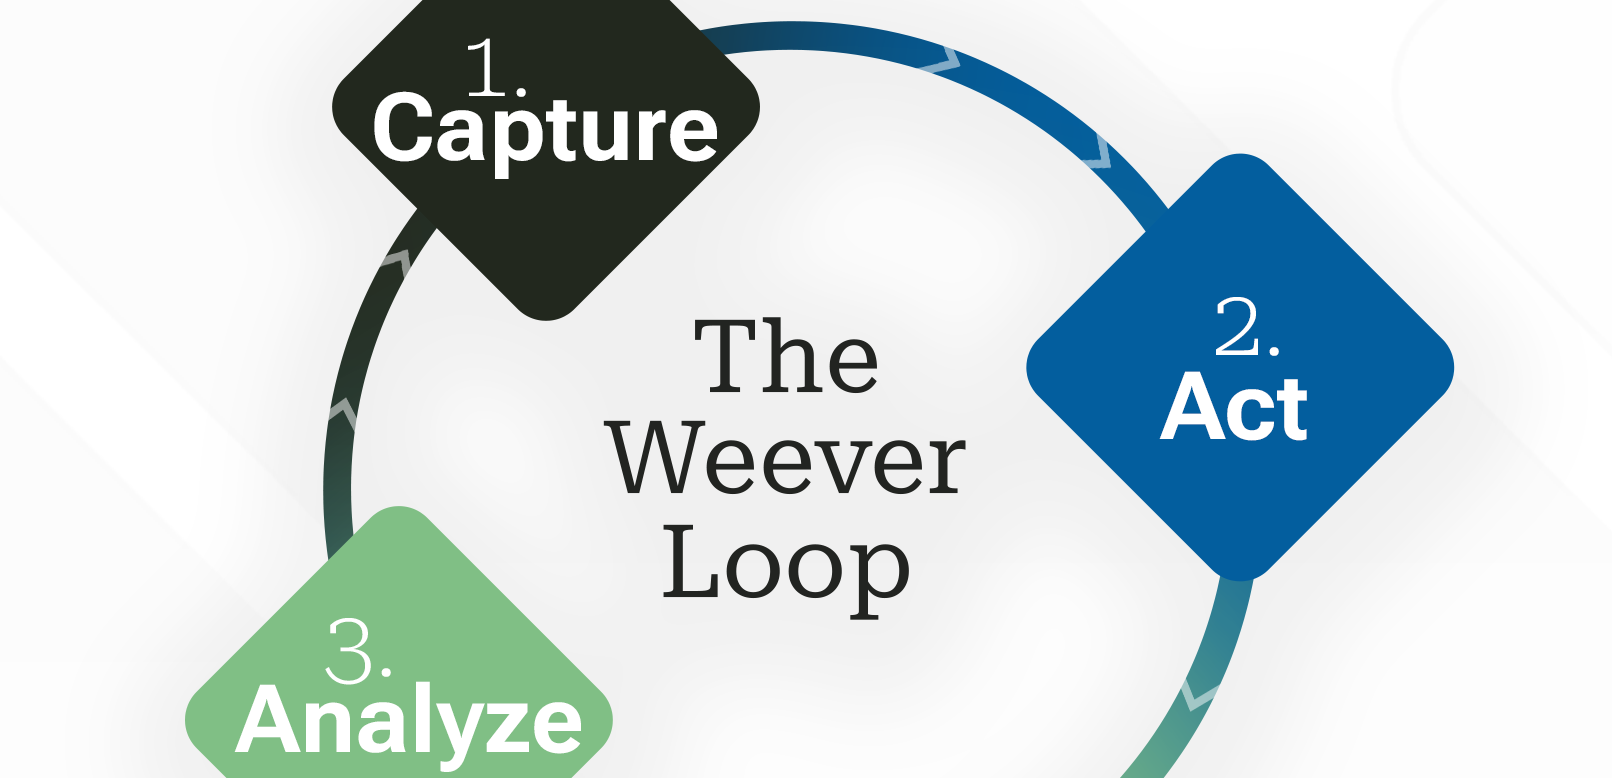
Weever runs AM as a loop instead of three disconnected steps:
- Capture the right check, from the right operator, with evidence, so the data is trustworthy from the moment it's collected.
- Act on every issue with an owner, a due date, and follow-through tracked to closure, so problems actually get fixed instead of logged and forgotten.
- Analyze the data that builds up across every line, shift, and site, so you can see what's driving your downtime and catch the next issue before it happens.
Each stage feeds the next. A completed CIL becomes a data point. A resolved abnormality becomes a pattern. A pattern becomes a prediction. Run the loop consistently and your AM program compounds. Skip a stage, and you're back to paper with better fonts.
1. Capture
Getting Trustworthy Data From the People Who Run the Machines
The hardest part of AM has never been getting operators to do the check. It's getting a version of the check that fits how your plant actually runs, getting it scheduled so it actually happens, and making sure the person doing it knows exactly what "correct" looks like at that machine. Weever handles all three.
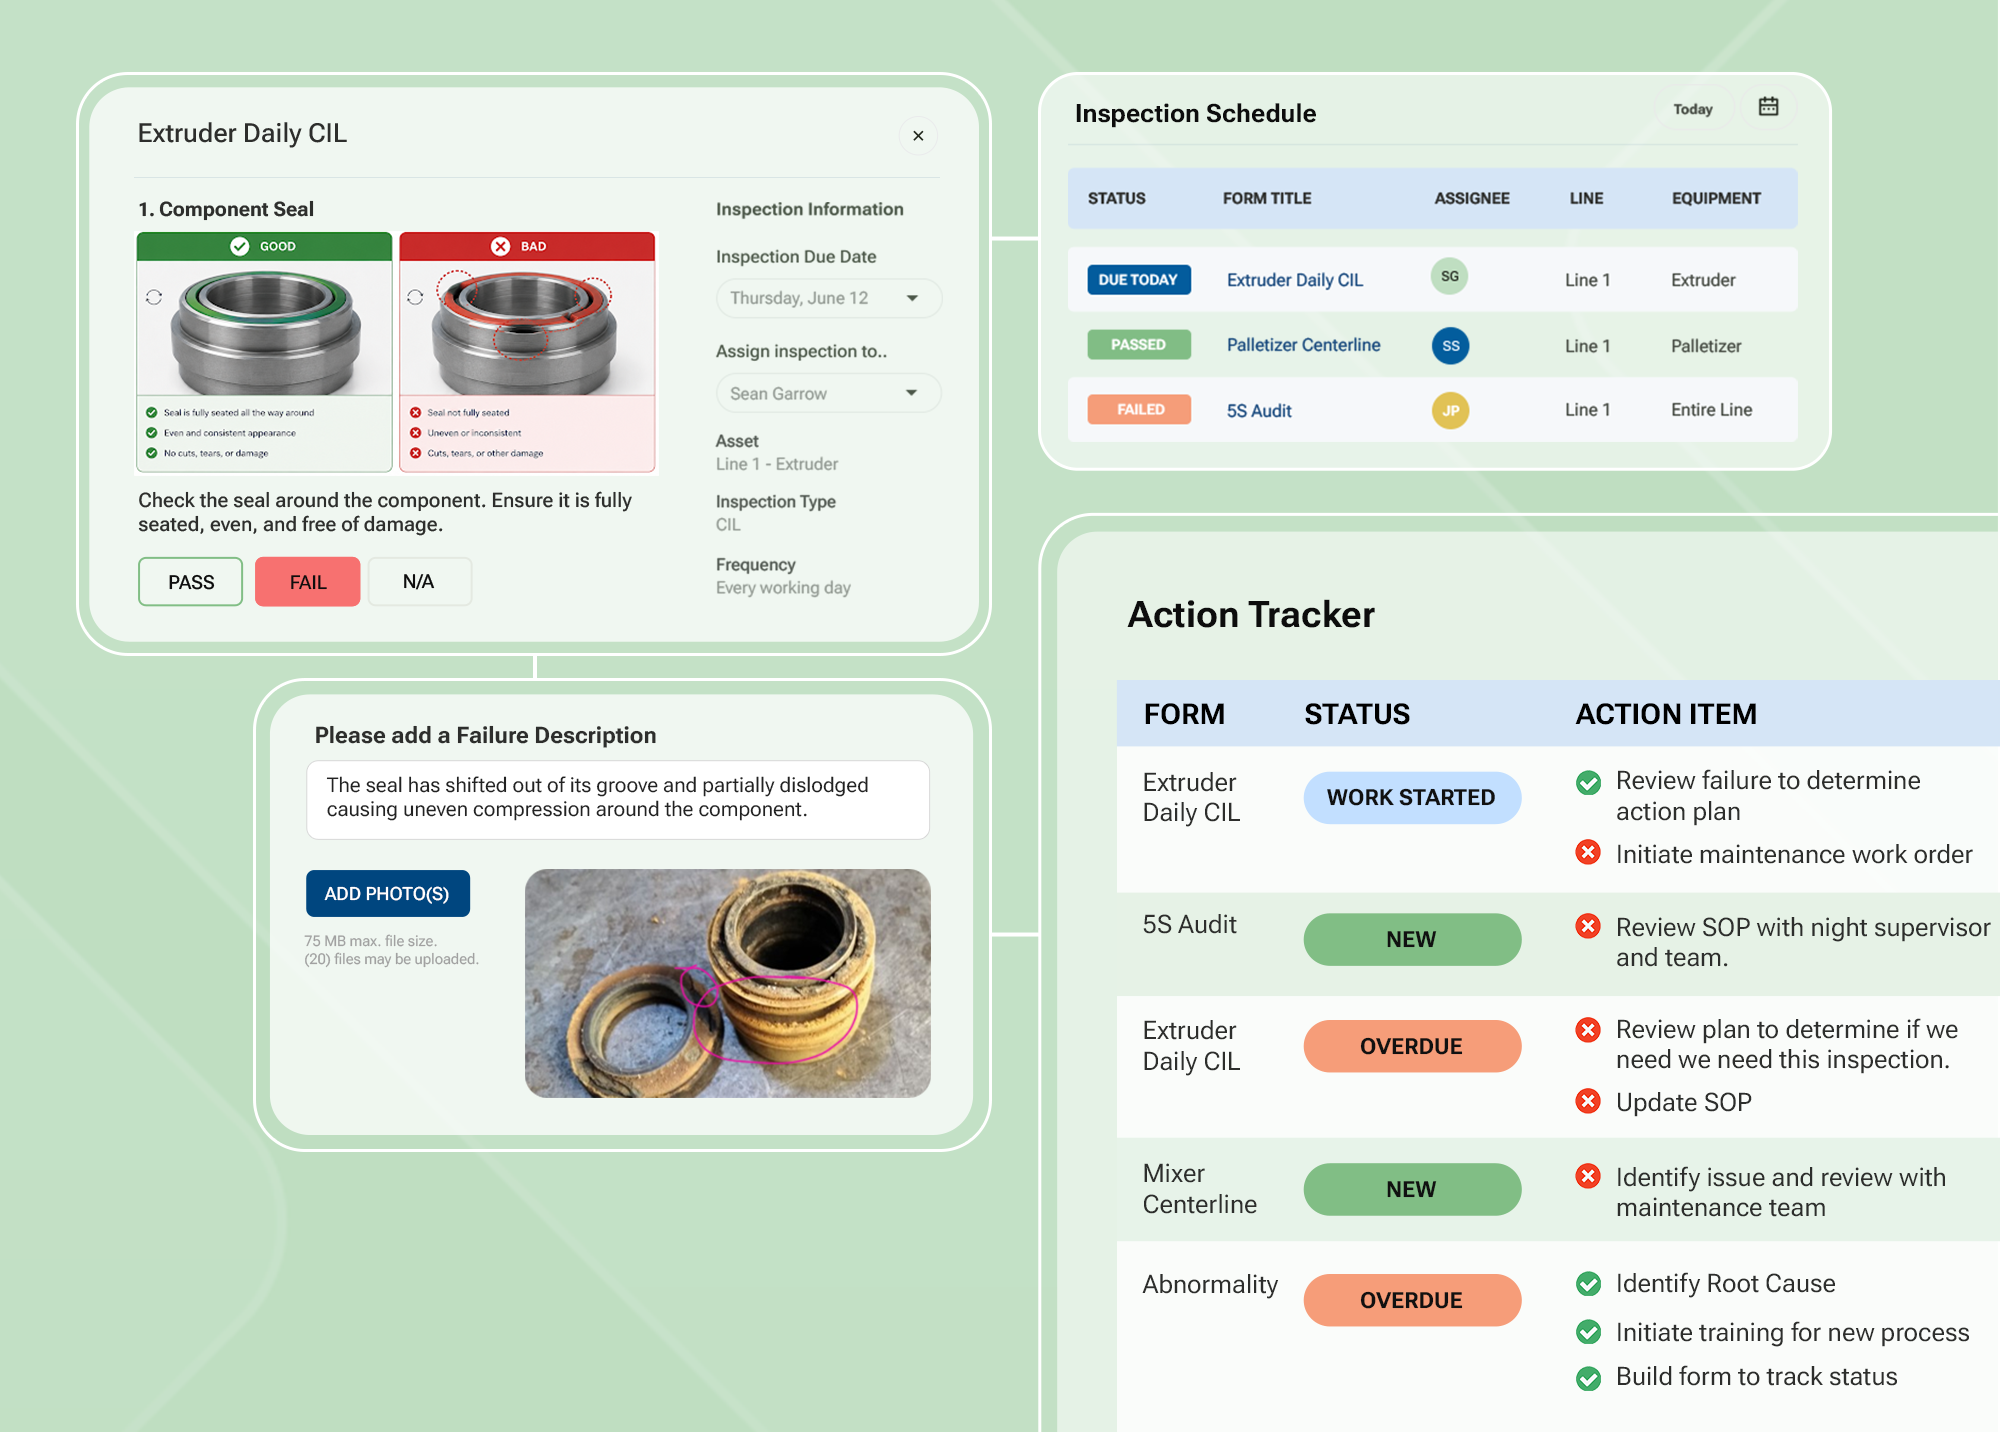
Form Builder: Do AM your way, not ours
Every plant's CILs, Centerlines, and 5S audits look a little different, because every line, every product, and every piece of equipment is different. Weever's Form Builder lets you build forms to match your program instead of requiring you to adapt your program to fit generic software fields.
Build your CIL checklists, Centerline ranges, 5S audit criteria, and Abnormality Reporting forms exactly the way your team already thinks about them, then push updates across every site without waiting on a developer.
Schedules: Make Sure High-Risk Areas Get Checked, Every Time
In manufacturing facilities we all know that it is not scheduled, it's not happening. Weever schedules and assigns inspections and audits automatically, so high-risk equipment gets checked at the frequency it actually needs, not whenever someone remembers.
Work Instructions: On-Demand, Real-Time Guides to Ensure The Work Is Completed Correctly
Knowing a check needs to happen is one thing. Knowing exactly how to do it correctly, on that specific machine, is another. Weever puts SOPs, One Point Lessons, video demonstrations, and reference images directly at the point of work, on demand, right where the operator needs them.
No walking back to the shop for the binder. No relying on whichever technician trained them three years ago. The instruction is right there on the device, at the exact step where it matters, so the job gets done correctly the first time.
2. Act
Turning Every Issue Into Closed Work, Not Lost Paperwork
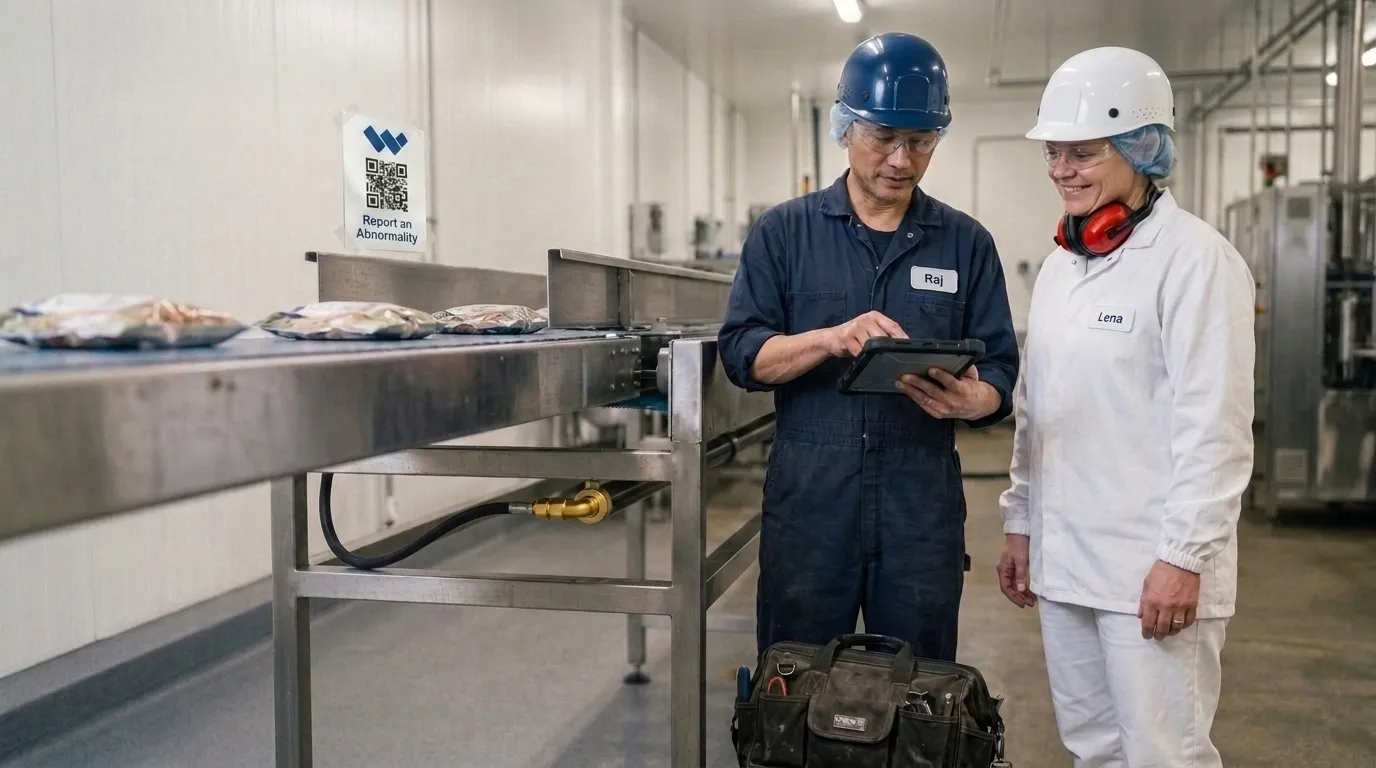
Capturing an abnormality is only useful if something happens next. This is where most paper-based AM programs quietly die: the report gets filed, and then it disappears. Weever closes that gap.
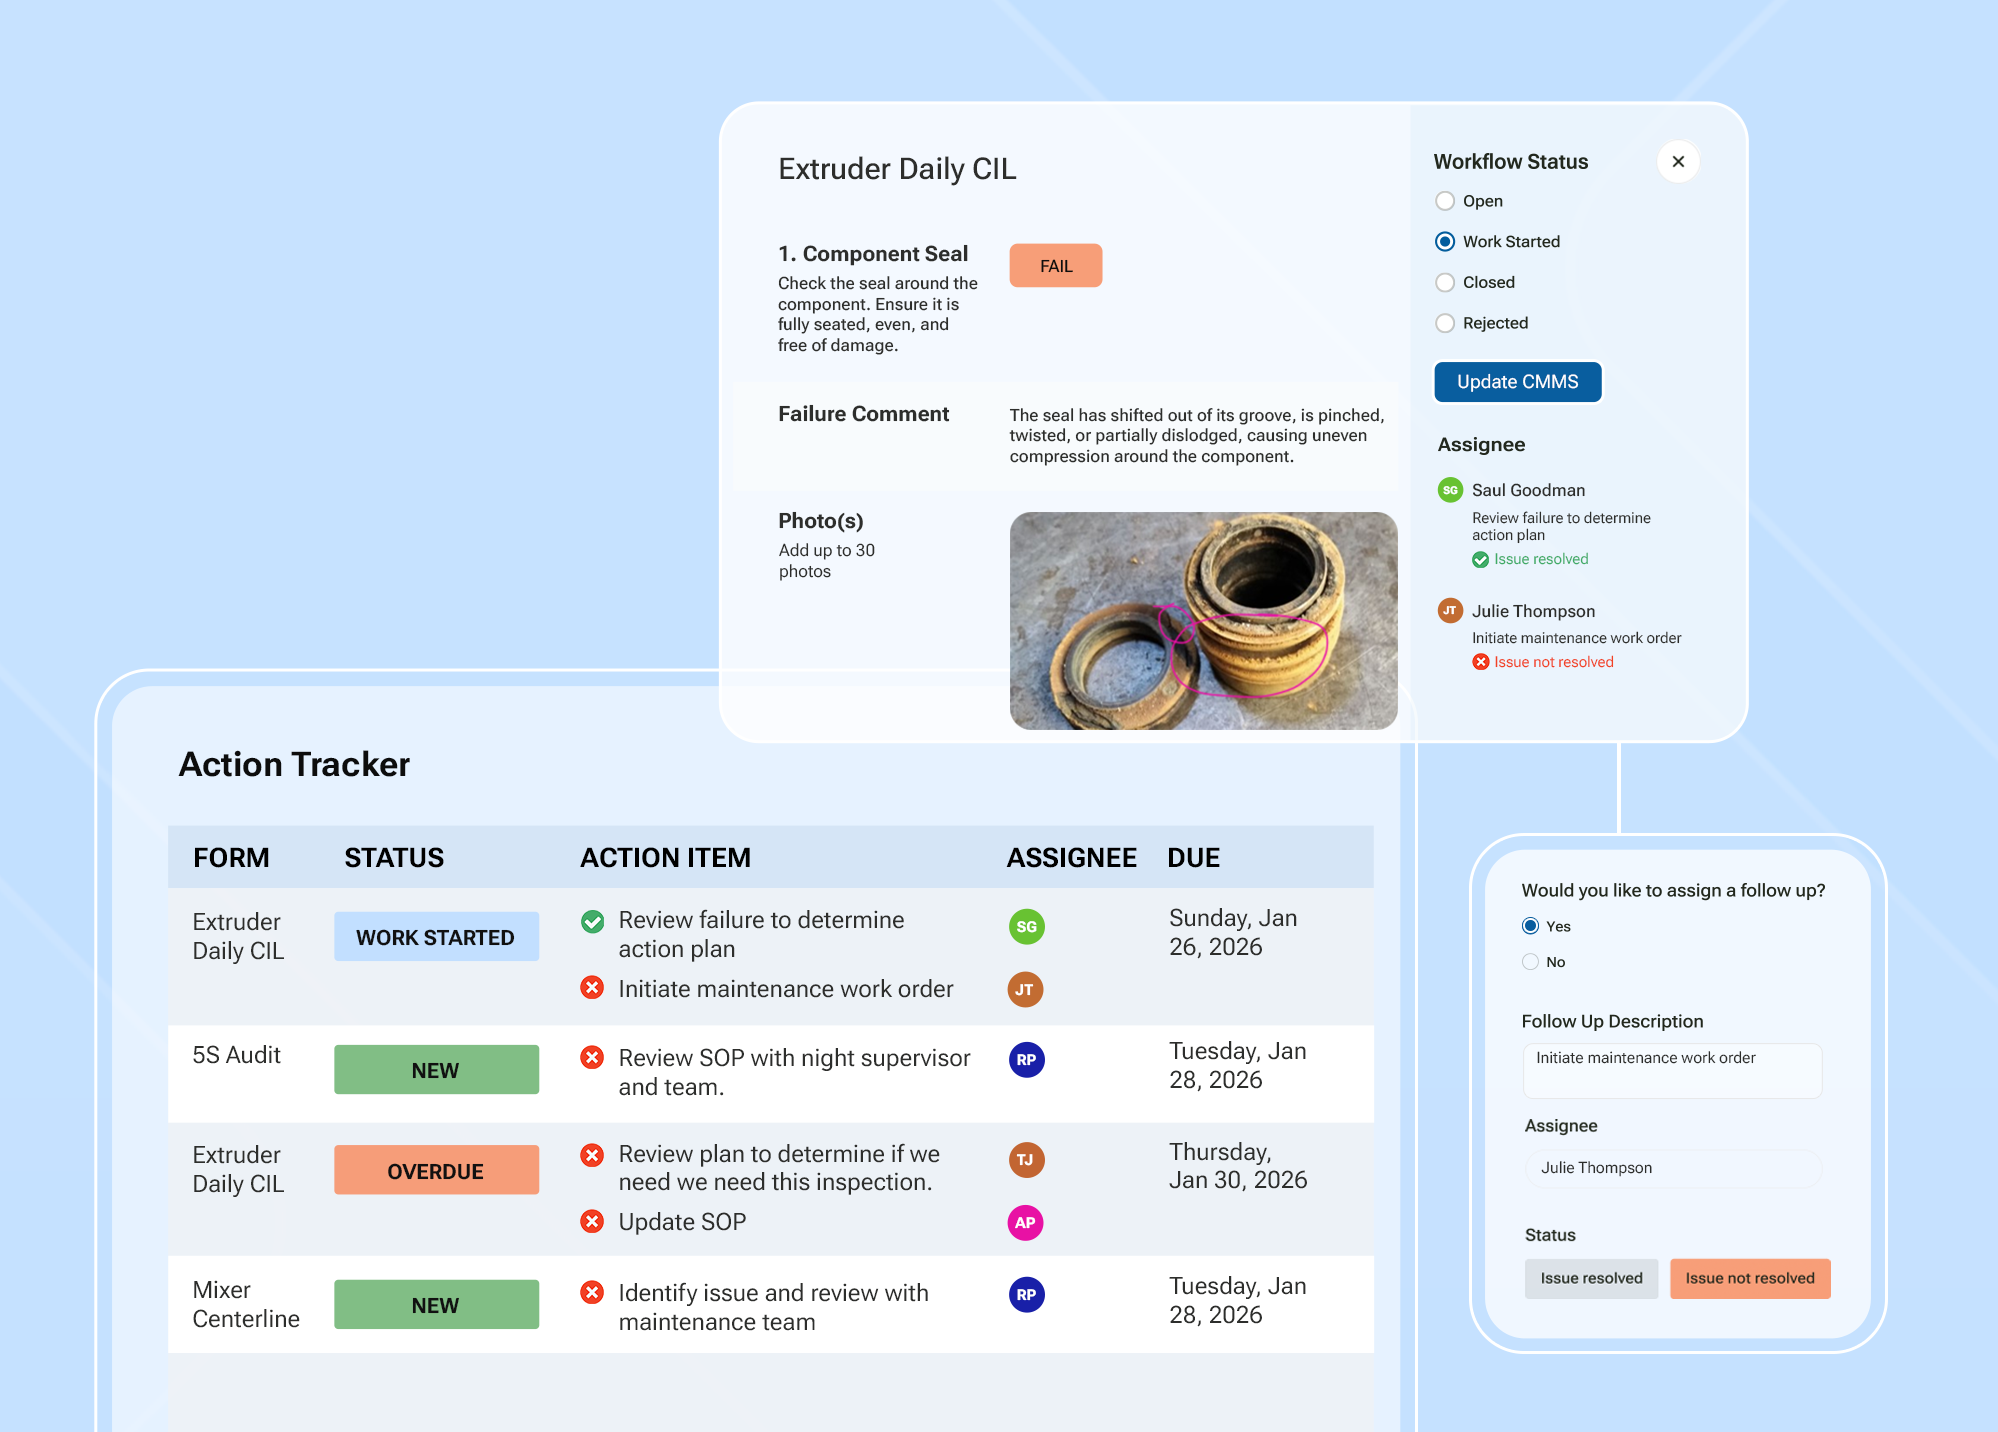
Action Tracker: Automatic Workflows That Route to the Right Person
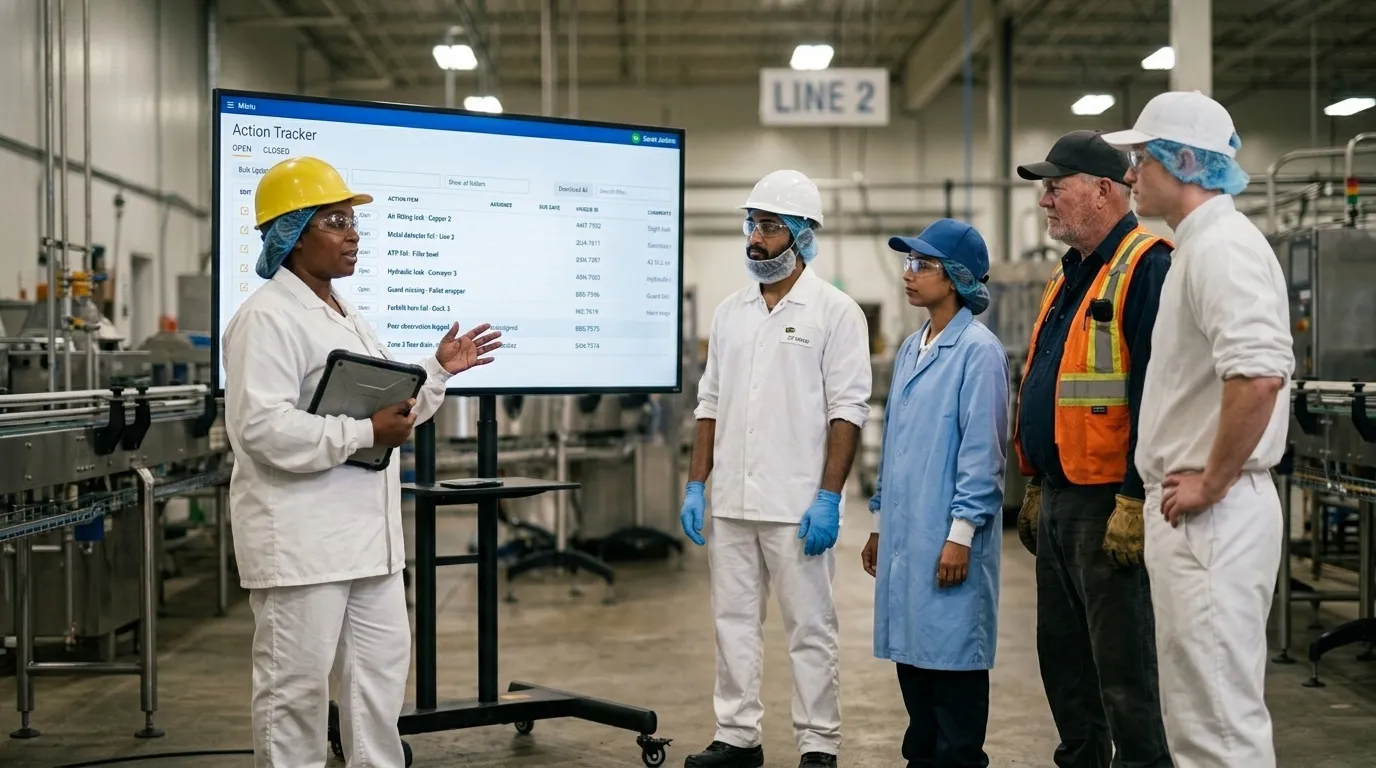
The moment a check fails or an abnormality gets reported, Weever's Action Tracker automatically builds a workflow around it. Supervisors get exactly the information they need to understand the issue: what happened, where, when, and what condition triggered it, without having to track anyone down or dig through paper.
Action Items: Assign It, Track It, Prove It's Done
A workflow can carry multiple Action Items, each with its own assignee, due date, and description of the work required. When the assigned team member resolves it, they mark it complete, log the date, and note what they actually did to fix it.
That closes the loop that paper never could. Every issue has an owner. Every fix has a record. And because your team can see their reports actually lead to action, they keep reporting instead of quietly giving up on the process. The cost of an AM program that runs on paper isn't the paper. It's the abnormality that got reported, filed, and never fixed, until it became the breakdown you didn't see coming.
3. Analyze
Seeing What's Happening Now, and What's Coming Next
Once your data is trustworthy and your issues are actually getting resolved, you've got something most AM programs never reach: a real, structured record of what's happening across your plant. This is where Weever turns records into insights and decisions.
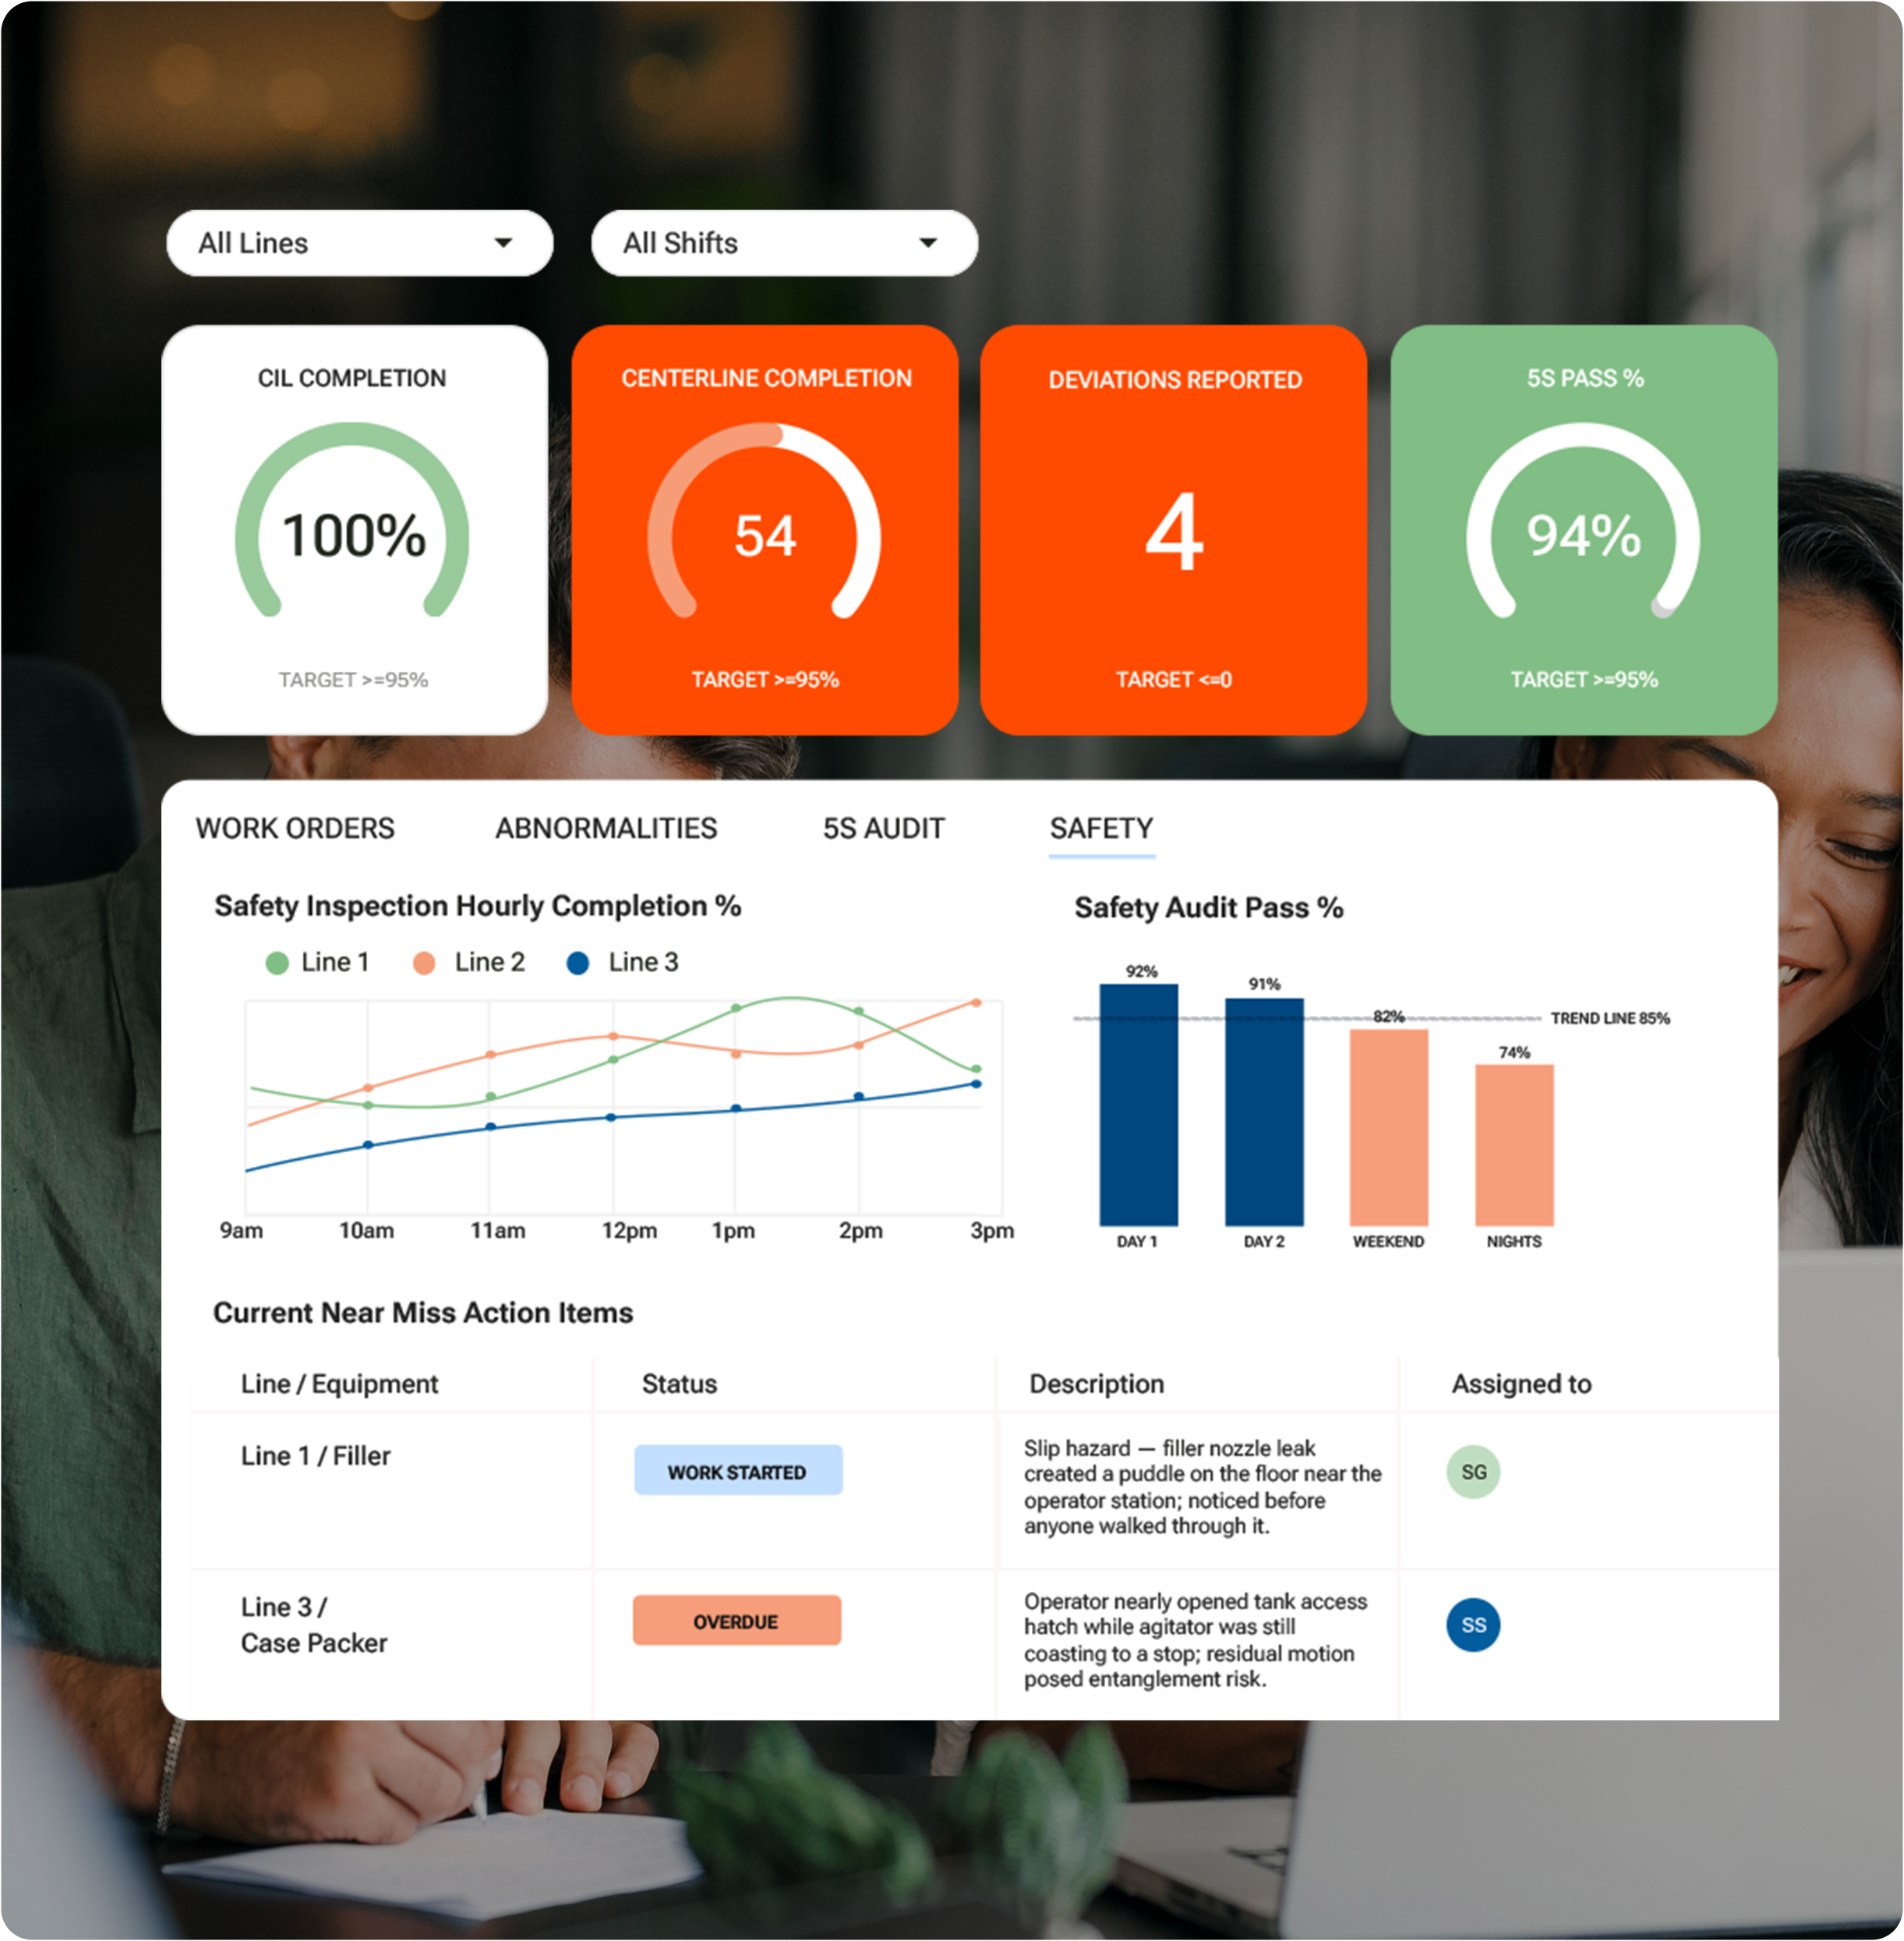
Weever Dashboard: Real-Time Visibility Into Completion
The Weever Dashboard shows the current status of every inspection and audit in real time, across every line, shift, and site. You're not waiting for an end-of-week rollup to find out a CIL got missed on nights. You see it as it happens, so you can course-correct before it becomes a pattern.
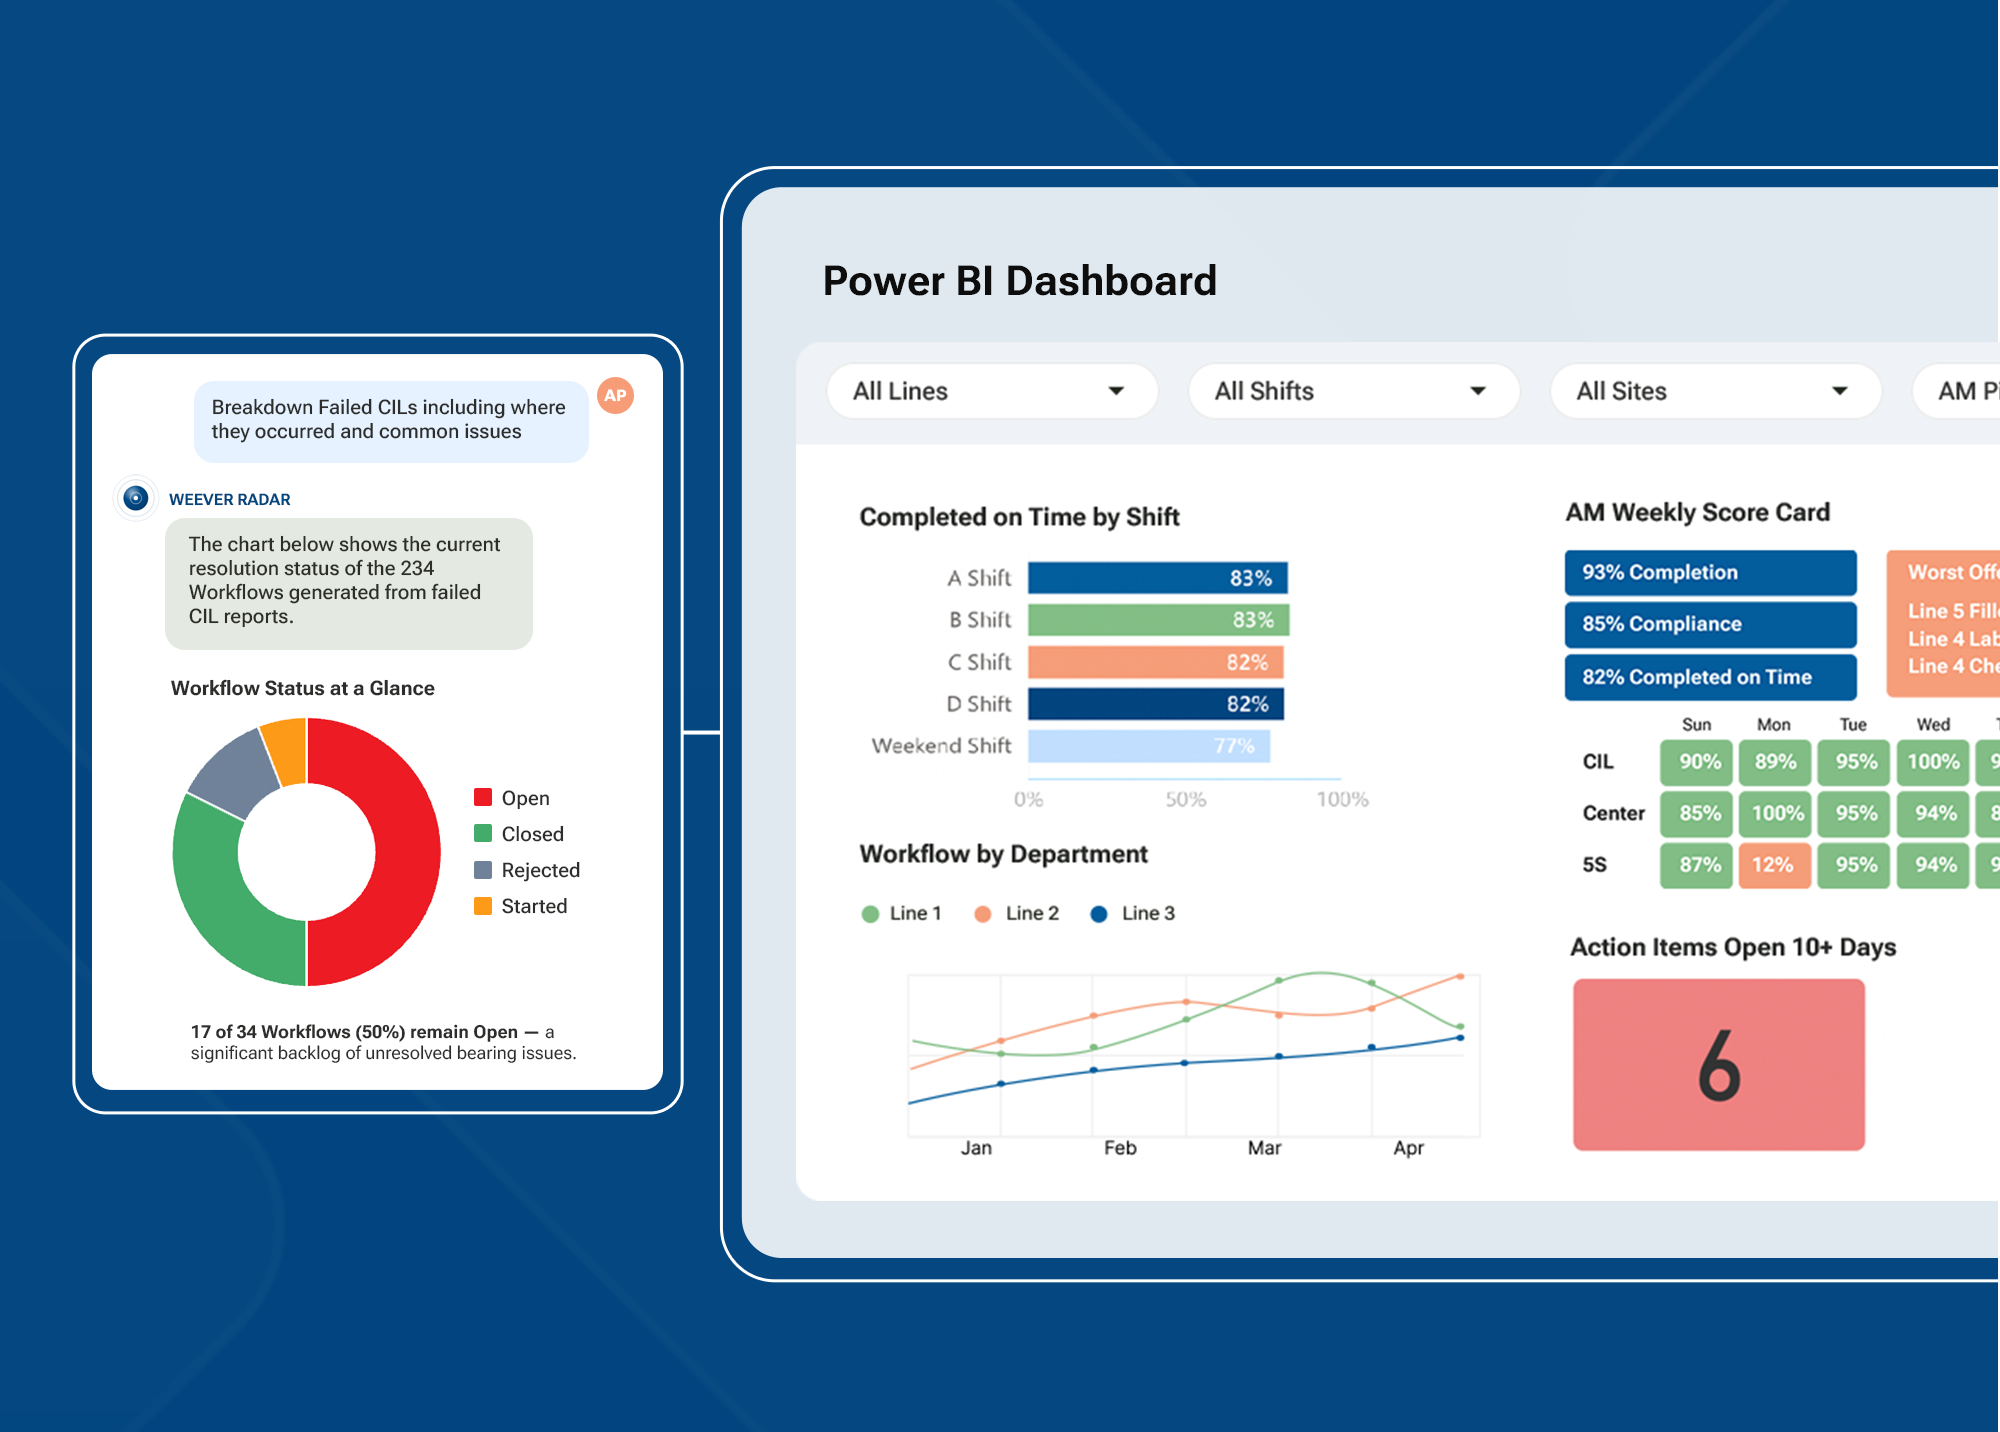
Data Feed: Feed Your BI Stack And Share With Other Systems
Your AM data shouldn't live in a silo. Weever's BI data feed makes it easy to share your frontline data securely with the business intelligence tools you already run, so your team can build the KPI dashboards and trend visuals that matter to your plant, without duplicate data entry or manual exports. You can also use the feed to share maintenance data with your CMMS so both systems are automatically updating each other.
Weever Radar: Ask Questions, Get Answers
Your operators already hear the bearing that's about to go. Weever Radar takes every abnormality, failed CIL, and out-of-tolerance Centerline reading your team has ever captured and turns it into a conversation. Ask what's driving downtime on Line 3, or which equipment is trending toward failure, and Weever Radar answers in plain language, tells you what it means, and recommends what to do next.
It's the difference between a dashboard that shows you numbers and a system that tells you what's actually happening and what to do about it, before a small deviation becomes a line-down event.
What a Connected AM Loop Is Worth
Once you run AM through Capture, Act, Analyze instead of paper, the numbers move fast:
- 30-50% reduction in breakdown frequency within the first year of a sustained AM program (Innovapptive, 2026).
- 15-25% OEE improvement within the first two years.
- A 10-point OEE gain on a packaging line can translate to roughly 15% more capacity, with no capital investment.
- Reactive maintenance costs 3-5x more per event than planned work.
- One widely cited AM case study, the Assela Malt Factory, saw a 46% drop in monthly breakdowns, a 64% reduction in maintenance costs, and 23% of technician time freed up for preventive work over an 18-month program.
- Weever customers report 500%+ increases in AM participation once teams move off paper, simply because the tool is easier than the binder it replaced.
Most food and beverage plants run at 55-65% OEE, well below the 85% world-class benchmark. The gap between those numbers is rarely a technology problem. It's a data problem: checks that don't get done, issues that don't get closed, and patterns nobody can see until it's too late.
Why Manufacturers Choose Weever for AM
- Built for the floor, not the boardroom. Weever was built by people who've worked in plants and know exactly what doesn't get used. Shared devices, multiple languages, no app install, no login. Adoption happens on the first shift and it sticks.
- Live in weeks, not months. There's no year-long implementation, no developer team required. Build your forms, schedule your checks, and start capturing real data fast.
- Priced for the whole plant. Weever is priced per site, not per user, so every operator who needs it can use it, without a per-seat cost gatekeeping adoption.
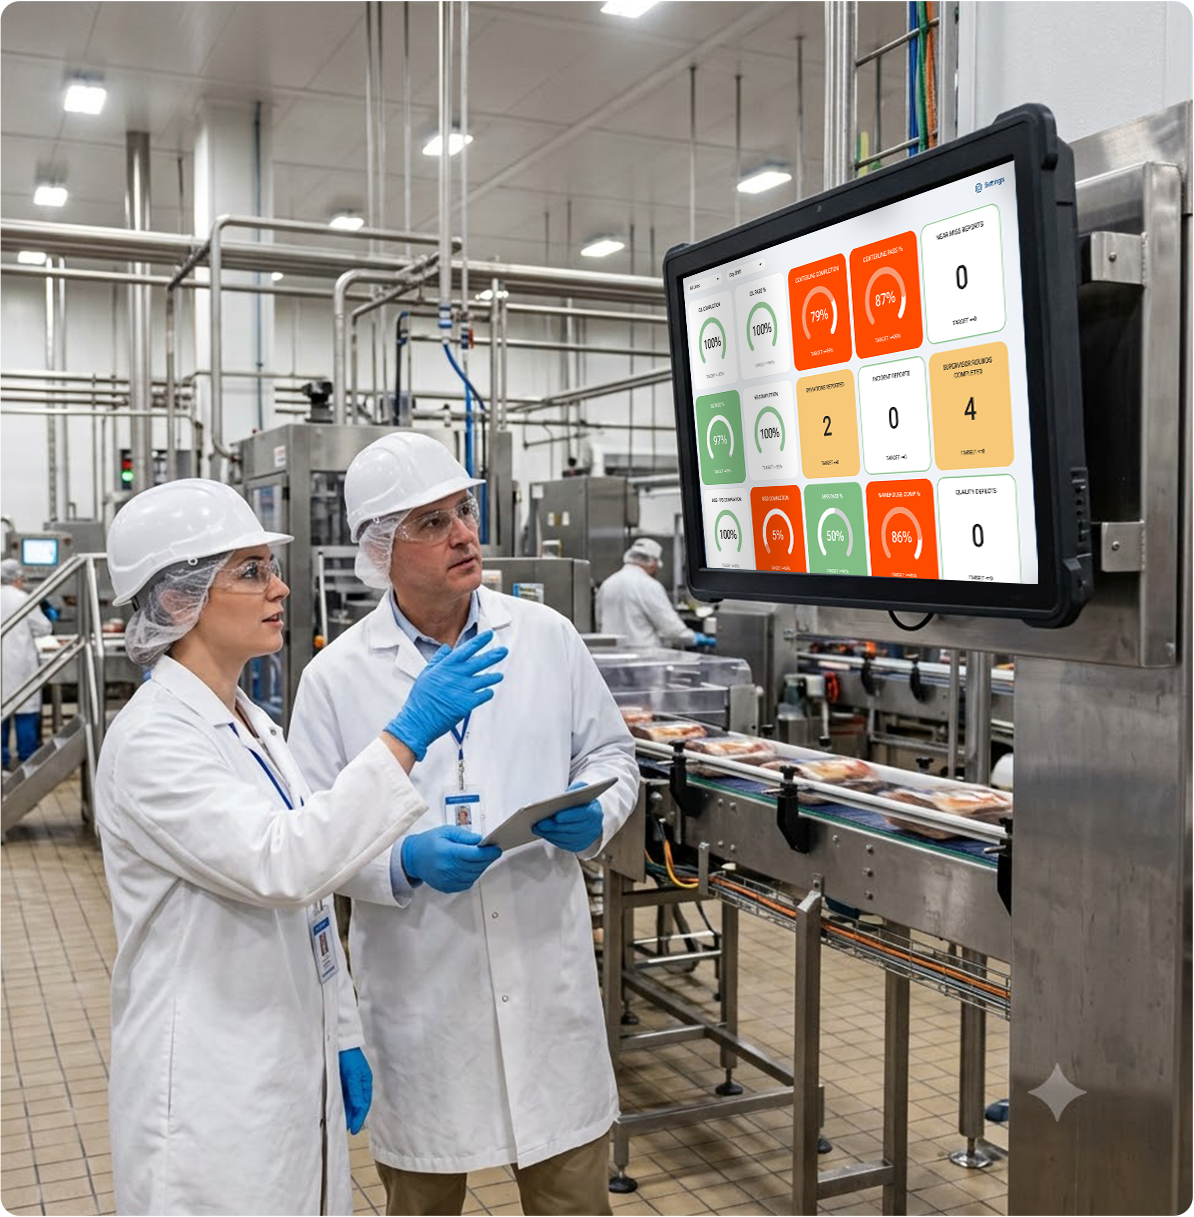
An AM program is only as strong as the data behind it, and the data is only as strong as the loop that captures it, acts on it, and turns it into insight. That's the whole point of running Capture, Act, Analyze as one connected system instead of three disconnected steps.
Want to see how Weever's Capture, Act, Analyze loop would run on your own lines? Book a demo and we'll walk through your CILs, Centerlines, and abnormality reporting live.
Spend Less Time on Admin. More Time Improving Operations.
See how Weever automates data entry, reporting, and action items so you can focus on improvement not admin.