
How to Use AI to Improve Your Continuous Improvement Programs in Manufacturing
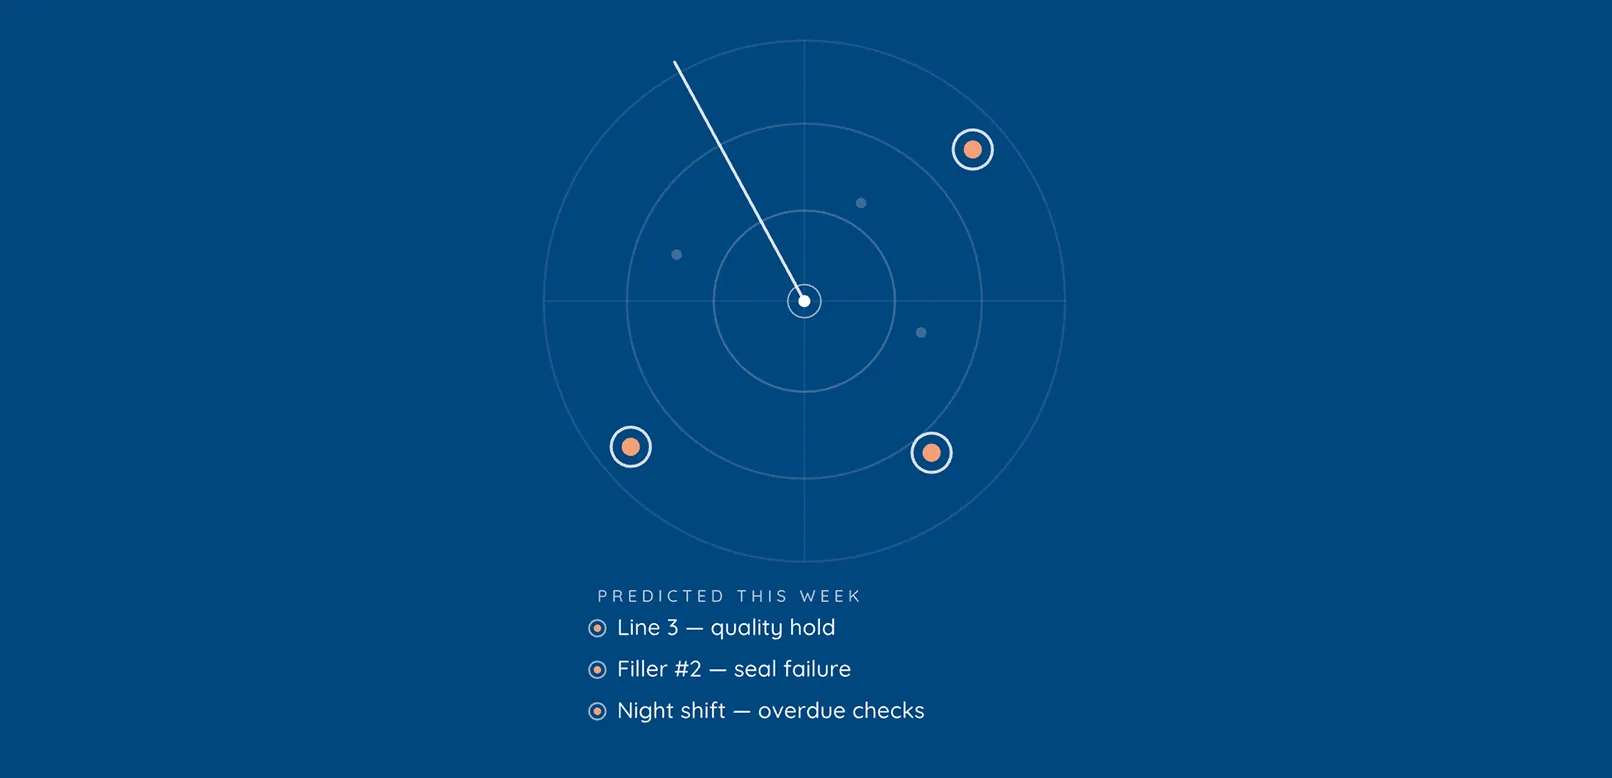
Table of contents

Share:


If you own continuous improvement across one plant or twenty, you may not be short on frontline data, but you are probably short on answers.
Your teams complete thousands of CIL checks, 5S audits, sanitation sign-offs, safety observations, and quality inspections every month. Somewhere in there is the answer to the question you actually care about: where is the next failure coming from, and what should my team do about it this week.
But getting that answer means pulling exports, rebuilding the same spreadsheet, and waiting on someone who has time to dig. By the time the report lands, the shift it describes is two weeks gone.
That gap is what Weever Radar closes. This article walks through what Weever Radar is, where it fits in the continuous improvement loop, and the specific questions you can ask it to find real improvements in your facility today.
What is Weever RadarTM?
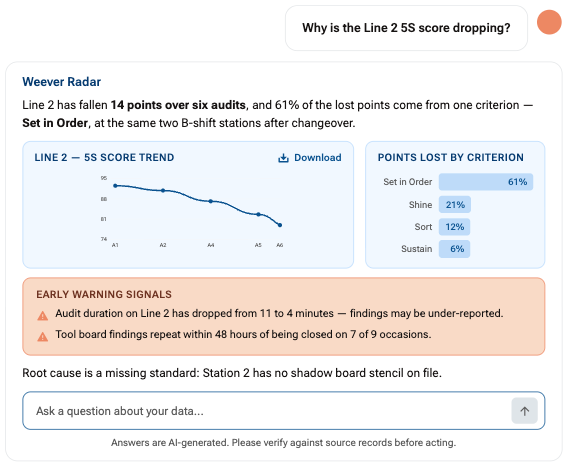
Weever RadarTM is the operational intelligence layer inside Weever, built for supervisors, managers, and plant leaders and powered by AI.
It turns the frontline data your team already captures in Weever into immediate answers, insights, and recommendations you can act on. It runs on the data you already have: safety observations, sanitation sign-offs, 5S and 6S audit scores, AM and CIL checks, quality inspections, and every corrective action attached to them. You ask a question in plain language and Weever Radar answers in seconds, with the context you need to act with confidence.
A dashboard shows you a number. Weever Radar tells you what is happening, what it means, and what to do about it, across every line, shift, and site at once.
It is also optional. Weever works exactly as it does today without Weever Radar, so you decide if and when AI is right for your plant, and you stay in control the entire time.
Where continuous improvement actually breaks down
Most CI programs do not fail at the idea stage. They fail at the analyze stage, and they fail quietly.
The frontline captures the work. Issues get raised. Then the data lands in five different places, in five different shapes, and nobody has the hours to connect it. So decisions get made on the loudest problem instead of the most expensive one.
Three things break in sequence:
- The admin tax. Supervisors and CI managers spend a large share of their week on manual data entry, spreadsheet upkeep, and report building. In sanitation alone, one Weever customer was losing 18 hours a week, 933 hours a year, to manual scheduling, chasing logs, and assembling audit reports before going digital.
- The context gap. Machine and sensor data tells you the what. The human operational context, the why, is the hard part, and it is usually stranded on paper or siloed in a legacy system. Without the why, you cannot fix a root cause. You can only react to a symptom.
- The engagement drop. When flagged issues go nowhere, people stop flagging them. Participation falls, the data thins out, and the program becomes a rubber stamp. Then every downstream insight is built on incomplete records.
The bottleneck in continuous improvement was never a shortage of data. It was the time between asking a question and getting an answer you trust.
Enabling the Continuous Improvement Loop
Weever Radar works at every stage of the loop, not just the last one.
Weever runs on a loop: capture what happens on the floor, act on every issue, analyze it all together, then do it again. Each cycle sharpens the next. Most people assume an AI layer only touches the reporting end of that loop. Weever Radar drives value at all three stages.
Capture
"For our last ten failures on Line 3, what information was missing that would have helped explain them?"
Find out what you should have been capturing. Nobody designs a perfect form. You build a check based on what mattered at the time and it runs unchanged for three years. Ask Weever Radar why a task keeps failing and a thin answer tells you something useful: the form never captured who was on shift, what equipment state they found, or a photo of the condition. The caveats in Weever Radar's answer are a list of the fields you are missing.
Weever Radar can also show you which fields return the same answer on nearly every submission and which checks have never once produced a fail. Those are costing seconds per submission across thousands of submissions a month and returning nothing. Cut them.
Act
"Suggest potential root causes for the five most recent failures."
Fix the cause, not the ticket. Weever already gives every failed check an owner, a due date, and follow-through tracked to closure. The harder question is whether you fixed the problem or just closed the record.
Weever Radar connects the activity to what is likely driving it. One customer's most-failed sanitation task was not failing because the standard was unclear. It was failing because it landed at the end of shift, every time, with no time left to do it properly. Coaching would never have fixed that. Moving it in the schedule did.
Analyze
"What patterns across our programs should I be paying attention to that I have probably missed?"
See it coming, and see what you were missing. Weever Radar points you to the recurring finding, the missed check, and the line trending toward trouble, so problems get caught before they become downtime, a hold, or an audit finding. Ask what is likely and you get a confidence level and the caveats stated plainly.
It also reads across programs. Because safety, sanitation, 5S, AM, and quality data all land in one structure, Weever Radar can find the patterns sitting between them, the joins nobody built a chart for. Every insight links back to the source records, so when your plant manager asks where the number came from, you can show them the sign-off and the photo behind it.
The loop only compounds if every stage feeds the next. Weever Radar is what keeps that momentum: sharpening what you capture, giving weight to how you act, and turning analysis into next cycle's standard.
Know the Unknown
Dashboards answer the questions you thought to ask. Weever Radar surfaces the ones you did not.
Every dashboard in your plant is an answer to a question somebody already asked. Someone decided what mattered, picked the fields, built the chart, and pinned it to a page. That is genuinely useful, and it is also the ceiling. A dashboard can only ever tell you the thing you asked to be told.
That covers your known unknowns. You know you do not know this month's 5S score for Line 4, so there is a tile for it. You know you do not know your overdue corrective action count, so there is a chart for that too. Those questions get answered because somebody anticipated them.
The problem is the other category. The insight that would have saved you the most money this quarter is almost never on a dashboard, because nobody suspected it was there to find. Nobody builds a chart joining night shift rotation to changeover defect rates. Nobody thinks to plot sanitation task timing against quality holds. The pattern sits across two programs that report separately, in two formats, owned by two different people, so it stays invisible.
Weever Radar reads across all of it at once. Because every program captures data in the same structure, safety observations, sanitation sign-offs, 5S scores, CIL checks, quality inspections, and every corrective action attached to them, Weever Radar is not limited to the fields someone chose to put on a page. It can connect things nobody thought to connect.
Weever Radar does not invent these connections. It finds them in the records your team already captured, which is exactly why the capture stage matters. Structure the data consistently across every program and the patterns are sitting there waiting. Leave it in binders and separate systems and no amount of AI will surface them.
Which makes the most valuable question the one you cannot ask a dashboard at all: "What patterns in our frontline data should I be paying attention to that I probably have not noticed?"
A Practical Guide to Working with Weever Radar
The 3 Levels of Weever Radar
Everything in Weever Radar starts with a question. It helps in three ways, and each one builds on the last: from a quick answer, to real understanding, to knowing your next move.
What you can ask Weever Radar today, program by program
This is the part worth sharing with your CI managers and supervisors. Below are the questions that produce an actionable answer on the first ask. Each one ends in a decision someone can make this week.
Autonomous Maintenance
5S and 6S Auditing
Sanitation and food safety
Safety and Behaviour-Based Safety Observations
Quality Checks
Cross-program and CI program health
The AI questions your team will ask
Everyone in manufacturing is being pitched AI right now, and your quality and IT leads are right to be sceptical. Good AI starts with good data, and good data starts with your people. Feed AI gaps and it will answer with confidence and get it wrong. Here is how Weever Radar handles the questions that come up in every evaluation.
Can we trust the answers?
Weever Radar runs on data captured at the source with photo evidence and timestamps, and wherever possible every insight links back to the source records so you can verify the observations and sign-offs behind it. Outputs are advisory. Your team makes the decisions.
Will our data be used to train AI?
No. Zero training is enforced at the infrastructure level. It is not a setting someone can switch off.
Where does our data go?
Data is processed only by models running in Weever's cloud. It is never sent to external AI services.
Is Weever Radar secure and compliant?
Weever Radar inherits Weever's existing security program: SOC 2 Type II certified, 21 CFR Part 11 commended, and aligned with GDPR and HIPAA.
Does Weever Radar touch our audit trail?
Weever Radar reads your data. It never alters records. The regulated audit trail required by standards like 21 CFR Part 11 stays intact.
Who can see what?
Weever Radar is permission based. If you do not want it to access certain data, it does not. When Weever Radar is off, none of your data is read or analyzed.
Do we have to use it?
No. Weever works exactly as it does today without Weever Radar. You decide if and when AI is right for your plant.
Why manufacturers choose Weever for this
The data is the moat, and it starts on the floor
Machine and sensor data is easy to collect and most plants already have plenty of it. The human operational context, the reason a check failed, is the hard part, and it is the part that makes an AI answer useful. Weever captures it at the source, in one consistent structure, across every program.
Adoption happens on the first shift
If operators will not use the system, none of this exists. Weever runs on shared devices with no login, in multiple languages, on whatever hardware your plant already has. Operators pick it up in minutes and admins train in about an hour.
Live in weeks, not months
Pilots in weeks, full rollout in a quarter. No developers, no servers, no IT project. You are not starting from a blank screen either: Weever builds your first workflows from your current process, your abnormality template, your CIL format, your SSOPs.
Your data stays yours
Weever spans the programs you already run, autonomous maintenance, safety and BBSO, sanitation, quality, and 5S and 6S auditing, on one platform instead of point solutions that cannot share data. It exports through OData, Excel, and MCP into the BI and enterprise systems you already have. We complement SAP, MES, historian, and CMMS. We do not replace them.
How to get value from Weever Radar in your first 30 days
- Pick one program and one question. Start with the program where your data is most complete, then ask the single question your last management review could not answer.
- Ask the follow-up. The first answer is a number. The second and third answers are where the improvement is. Train your supervisors to keep asking why.
- Verify against the source. Click through to the underlying records the first several times. Confidence in AI is built by checking it, not by being told to trust it.
- Change one standard. Use what Weever Radar surfaces to adjust one CIL route, one audit criterion, or one sanitation schedule. Then measure whether the failure rate moves.
- Give it to the supervisors. Weever Radar earns its keep when the person walking the floor at 6am can ask it a question before they leave the office, not when it lives with one analyst.
- Then widen it. Once one program is producing answers your team acts on, add the next. The dataset gets richer and the answers get sharper with every program you connect.
Where this leaves you
Continuous improvement has always depended on how fast you can turn what happened on the floor into what your team does next. The plants that connect their frontline data and act on it will pull ahead. The ones that do not will fall behind.
Want to see what Weever Radar finds in your own programs? Book a demo and we will walk through the questions your team would ask first, using your process, your programs, and your data structure.
If it is not on your radar, it is on Weever's.
.webp)

Spend Less Time on Admin. More Time Improving Operations.
See how Weever automates data entry, reporting, and action items so you can focus on improvement not admin.