
How Many Centerline Points Should Your Line Actually Have?

Table of contents

Share:


Ask a reliability engineer how many centerline points a packaging line should have and you will get a thoughtful answer about criticality. Ask an operator and you will get a much shorter one: as few as possible.
Both are right, and the tension between them is where most centerline programs go wrong. Every variable you can measure looks worth measuring when you are building the form in an office.
On the floor, in the four minutes between a changeover and a run, a form with sixty readings on it does not produce sixty readings. It produces a habit of writing down what the value usually is.
The number that matters is not how many points you could monitor. It is how many get read accurately, every time, by someone who has other work. This article covers how to land on that number, how to decide which points earn a slot, and how to know when the count is wrong.
The short answer
For most lines, somewhere between 5 and 20 points. Some lines have hundreds or even thousands of candidate variables, and the useful range is a small fraction of them.
That number surprises people, and the instinct is to treat it as a compromise. It is not.
A tight set of points that are genuinely read tells you more about process stability than a comprehensive set that is partly fabricated, because fabricated data does not just fail to help. It actively misleads. A drifting value that gets recorded as its usual number is worse than a value nobody recorded, since one leaves a gap and the other leaves a false negative.
How to decide which points earn a slot
Apply ECRS, the lean four-step: eliminate, combine, reduce, simplify. Run every candidate variable through it.
1) Eliminate
Does anything change based on this reading? If a variable goes out of range and nobody would act differently, it is a measurement, not a control. Cut it. This alone usually removes a third of a first-draft list.
2) Combine
Are you reading three points that always move together? Pick the one that moves first. Redundant readings feel like rigour and cost you the same shift minutes as useful ones.
3) Reduce
Does this need reading every shift, or would weekly catch the drift in time? Frequency is a lever most programs never touch. A variable that drifts over weeks does not need a daily reading, and moving it to weekly buys you room for something that does.
4) Simplify
Can the operator get this reading without a tool, a ladder, or a guard removal? A point that requires effort to reach is a point that gets estimated. If it genuinely matters, make it reachable or accept that you are getting a guess.
What survives should meet three tests: the variable affects output quality or equipment health, drift in it is detectable before failure, and someone will act when it goes out of range.
Set the ranges from your own good shifts, not just the manual
Most equipment manufacturers provide optimal operating conditions, and those are the right starting point. They are not the right ending point.
The better approach, and the one experienced plants use, is what is often called Run the Target. When a shift runs well, document the settings. Not the OEM ideal, the actual configuration that produced a good run on your line, with your product, in your ambient conditions. Over time you build ranges that reflect your reality rather than a general specification.
Centerlining is part science and part accumulated experience, which is why the range you set in month one should not be the range you are still using in year two. Blending vendor baselines with your own production history is how you get limits that are tight enough to catch drift and loose enough not to cry wolf.
The signs your count is wrong
Too many points. Watch for completion time falling while completion rate stays high, readings clustered suspiciously close to the middle of the range, identical values submitted shift after shift, and out-of-tolerance findings approaching zero. That last one is the clearest tell. A form that never finds anything is not evidence of a stable process. It is evidence that nobody is looking.
Too few points. Watch for breakdowns and quality holds with no preceding signal in the data. If a failure investigation keeps concluding that a variable drifted and nobody was watching it, you have found a point that earned a slot.
The useful practice is to review the set quarterly against both lists. Add what failure investigations tell you to add, cut what has not found anything in six months.
Why this decision is harder on paper
On paper you cannot see any of the signals above. You get a stack of forms with numbers on them, and no way to know whether the numbers were read or remembered.
Three things change when readings are captured digitally at the machine. First, you see the value rather than a pass or fail, so drift is visible before it becomes a violation. Pass or fail without the number costs you every trend you might have found. Second, you get the time it took, which is your early warning that the form has outgrown the shift. Third, you can trend a single point across shifts and lines, which is how you find out that a variable is stable on line one and wandering on line three.
That last one is where the count gets genuinely smart, because the right number of points is not the same on every line, and you cannot know that without comparing.
For the mechanics of maintaining centerlines once they are set, see achieving process stability through centerlining. For where centerlines sit in the broader program, what autonomous maintenance is covers the three core activities.
What the payoff looks like
Centerline discipline is unglamorous and it moves the numbers that matter. OEE is availability multiplied by performance multiplied by quality, and drifting settings attack all three: they produce stoppages, they rob speed quietly, and they generate defects. Food and beverage plants typically run at 55 to 65 percent OEE against an 85 percent world-class benchmark, and a meaningful share of that gap is variability nobody was watching closely enough to catch.
For scale, a 10-point OEE improvement on a packaging line is roughly 15 percent more production capacity with no capital investment. You do not get there by measuring more things. You get there by measuring the right small set accurately enough to trust.
Why manufacturers run centerlines on Weever
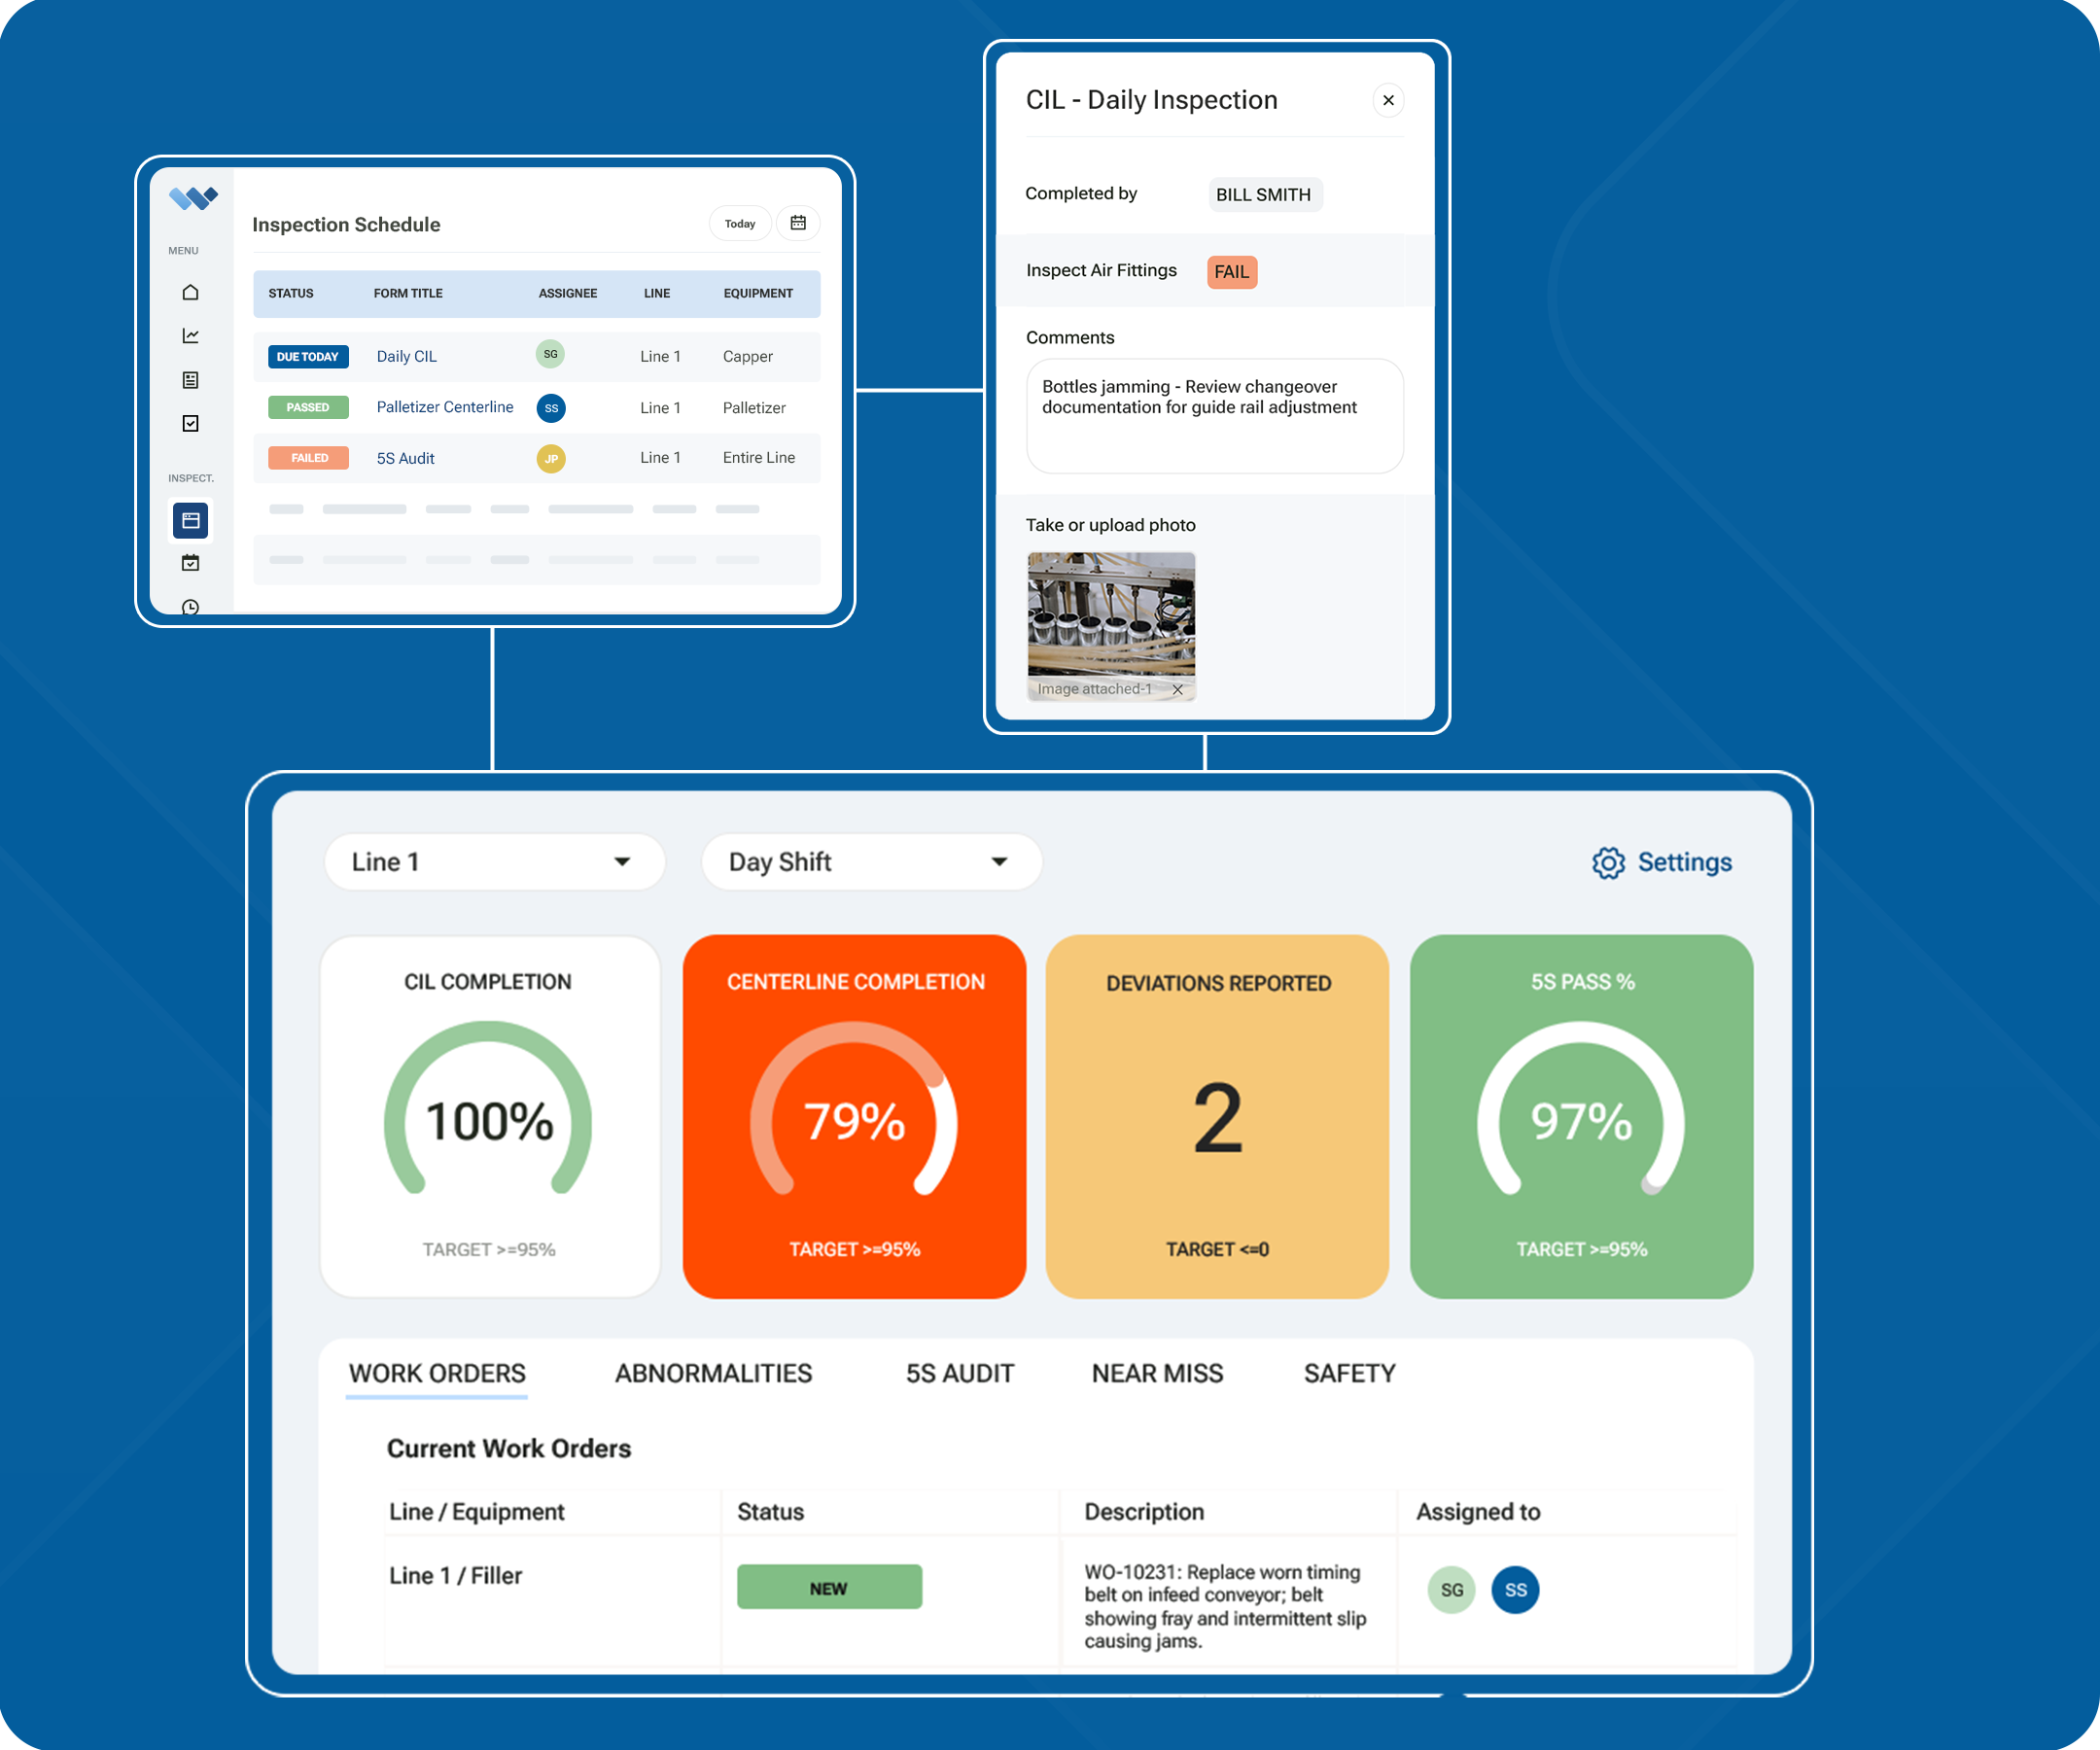
- The target range sits next to the field. Operators see the acceptable range as they enter the reading, so an out-of-tolerance value is obvious at the moment it is recorded rather than at month end.
- Readings are values, not checkmarks. Numeric capture means you can trend drift across shifts, lines, and sites instead of counting violations after the fact.
- Out-of-tolerance readings route themselves. With photos and context attached, straight to the person who can act, without anyone carrying a form to an office.
- Standards update everywhere at once. When a range changes, it changes in the form, so the current version is the only version on the floor.
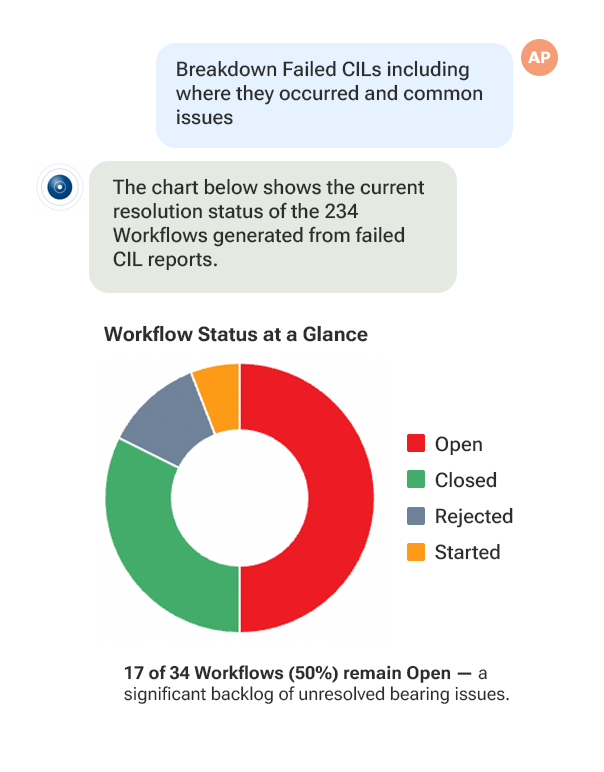
- Weever RadarTM watches the whole stream. Every CIL, centerline reading, and abnormality report across your floor, finding the patterns nobody has time to dig for, so a drifting setting gets attention before it becomes a stoppage. And it is entirely your choice: Weever works exactly as it does today without Radar.
More on the full activity set on our autonomous maintenance software page.
Fewer points, read properly
The best centerline program on a line is the one where every reading on the form is a real reading. That almost always means a shorter form than the one you first drafted, reviewed quarterly, with ranges tuned from your own good shifts.
If you want a second opinion on your current point count, book a demo and bring your centerline form. We will walk it through ECRS with you and tell you which points we would cut.



Spend Less Time on Admin. More Time Improving Operations.
See how Weever automates data entry, reporting, and action items so you can focus on improvement not admin.