
Designing an Effective Autonomous Maintenance Board
Table of contents

Share:


Walk past most autonomous maintenance boards mid-shift and you'll see the same thing: a laminated chart from the launch, a KPI graph last updated in spring, and a pen on a string that nobody has touched in weeks.
A board like that tells operators the program is over. A good one does the opposite. It shows, at a glance, what's due today, what's been reported and what got fixed, and it's where the shift huddles every morning. The difference isn't design talent. It's choosing the right content and keeping it current.
This guide covers what goes on an autonomous maintenance board (sometimes called an AM activity board), how to lay it out, how to run it day to day, and where digital data fits. If your plant is new to autonomous maintenance, start with what it is and how it works on the line.
What is an Autonomous Maintenance Board?
It's a visual management board at the line that shows the state of the AM program for that area: inspection status, open abnormalities, key settings, results, and the standards operators work to. It's also the meeting point for the daily huddle. If you're building a program from scratch, start with the 7 steps of autonomous maintenance; the board supports steps 4 to 7.
What goes on an Autonomous Maintenance board
Most effective boards have the same eight sections, laid out so the ones that change daily sit at eye level.
Eye level: changes every shift
Equipment map
Line photo with numbered check points
CIL status
Done, missed or due, by shift
Open abnormalities
Severity, owner and age
Key settings
Centerline targets and ranges
Below: changes weekly or less
A few KPIs
Three or four, trended over weeks
Step and skills
Where the line is in the 7 steps, who’s trained
One Point Lessons
Current OPLs and recent wins
Ideas and actions
Suggestions and what happened to them
- Equipment map. A photo or drawing of the line with numbered inspection and lubrication points.
- This week's CIL status. Which checks are done, missed or due, by shift.
- Open abnormalities. Every reported issue with its severity, owner and age. Red, yellow and green should match your tiered response.
- Key settings. The centerline targets and ranges operators check most.
- A few KPIs. Three or four, trended over weeks: breakdowns, CIL completion, abnormality close rate, OEE.
- Where the line is in the 7 steps, plus who's trained on what.
- One Point Lessons. Current OPLs and recent wins, such as a failure caught before downtime.
- Ideas and actions. Improvement suggestions and what happened to them.
Design rules that keep the board readable
- One board per line or area. A plant-wide board is too far from the equipment and too crowded to read.
- Fewer metrics, shown as trends. Three or four KPIs over time beat a dozen numbers for today.
- One colour language. Use the same red, yellow and green everywhere: on tags, gauges, the board and the forms.
- Put it where the huddle happens. At the line, at eye level, with room for the team to stand.
- Leave space for handwriting. Operators should be able to add a note or idea in seconds.
- Link to the detail. QR codes on the board can open the current checklist, OPL or SOP.
Physical, digital, or both?
| Item | Physical board | Digital display |
|---|---|---|
| Best for | Huddles, ownership, quick notes | Live status, trends, multi-shift and multi-site views |
| Kept current by | People, by hand | Updates as operators submit checks and reports |
| Weak spot | Goes stale when nobody updates it | Ignored if it’s a screen nobody gathers around |
| Best use | The meeting point at the line | A screen beside the board, or the data feeding it |
Most plants do best with both: a physical board where the team meets, with live data from the digital system shown beside it.
How to run the board day to day
- Hold a 10-minute huddle at the board each shift or day. Review missed checks, new abnormalities and anything overdue.
- Rotate ownership. A different operator keeps the board current each week.
- Review it monthly. Drop sections nobody uses; add what the team keeps asking for.
Where AM boards go wrong
- Stale data. The fastest way to kill a board. If updating it takes more than a few minutes, it won't happen.
- Too much on it. Every extra metric makes the important ones harder to find.
- Nothing happens. If abnormalities sit on the board for weeks, the board becomes a record of being ignored.
How Weever keeps the board current
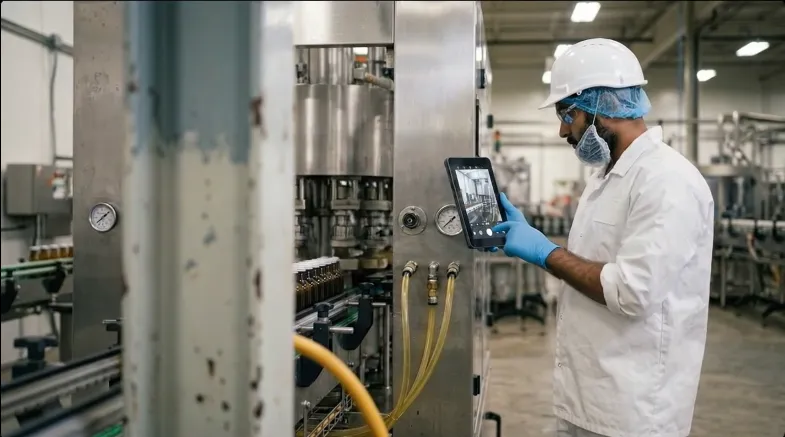
When operators submit CIL checks and abnormality reports in Weever, completion, open issues and trends update automatically, so a screen beside the board shows the same picture as the system. QR codes on the board open the right form at the right machine. Mars Fort Smith, a Mars site we worked with, put its AM forms on iPads with QR codes and used live Power BI reports to find gaps, reaching an 89% abnormality close rate.
See your board’s data update itself
Book a demo and bring a photo of your current AM board. We’ll show you which sections Weever can keep current automatically.
Book a demo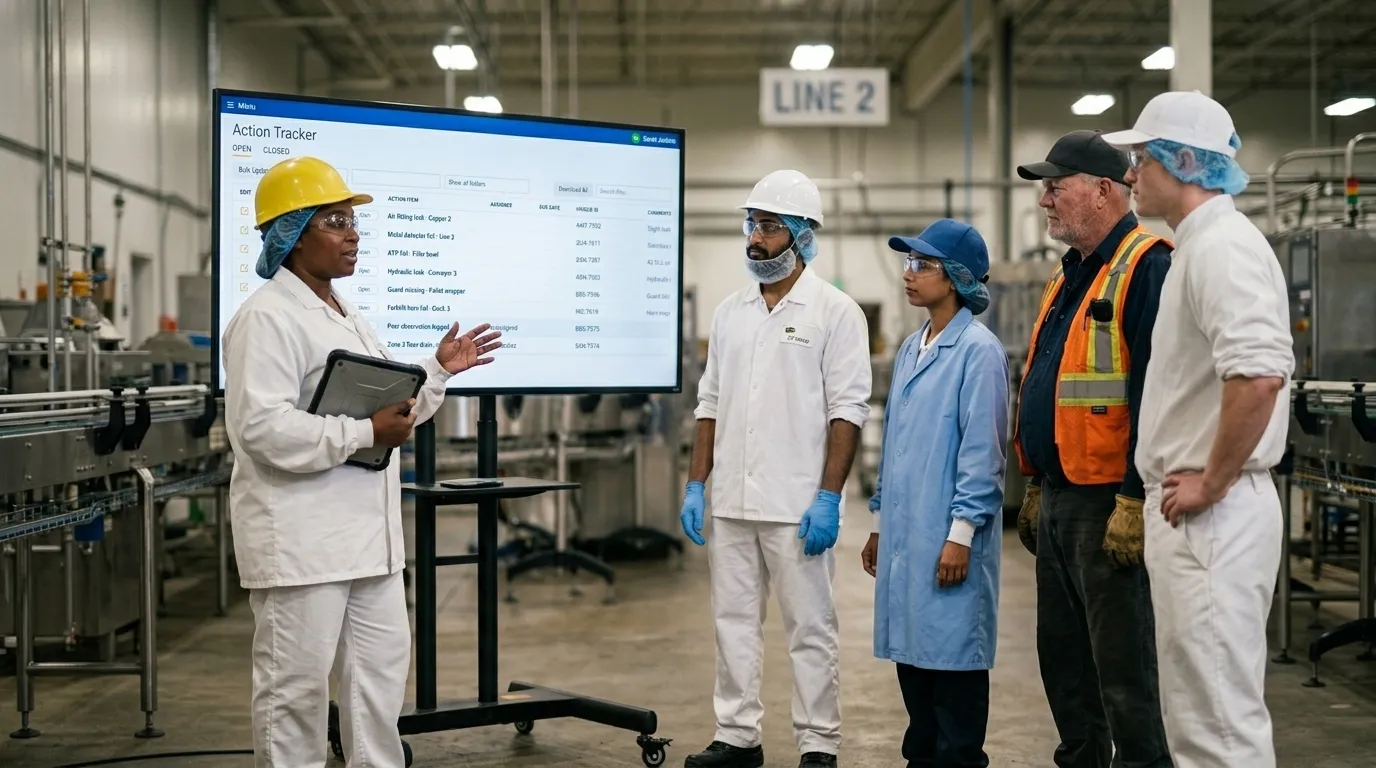
Spend Less Time on Admin. More Time Improving Operations.
See how Weever automates data entry, reporting, and action items so you can focus on improvement not admin.